By Catherine Austin Fitts
My “go to” website for technical analysis of precious metals, the US dollar & the US stock market is Rambus Chartology, where Rambus (that’s his handle – he’s the founding technical analyst) leads a discussion with extensive charts of what the markets are saying.
In January 2016, Rambus launched his quarterly Solari Report with a Blockbuster Chartology. You can find links to the entire series of quarterly and annual Blockbuster Chartologies at the end of this latest piece.
One of the reasons that Rambus is so good at his craft is that he focuses on “staying on the right side of the major trend.” The challenge of doing so at this time is that it is tempting to look for bottoms or to assume that the trend upwards in the US dollar or stock market may be over. However, Rambus consistently brings us back to the discipline of the Chartology. What does price tell us? As he describes so aptly, we are dealing with psychological warfare.
Sitting back once each quarter to get this perspective offers invaluable insight. So, here we go for the 3rd Quarter 2020 Blockbuster Chartology!
Blockbuster Chartology Quarterly Report
By Rambus
~ 3rd Quarter 2020 Wrap Up ~
Quarterly Report PM Sector…
When trading the markets from the intermediate to long term the first and most important question to ask yourself, is it in a bull or bear market? The number one rule is to always trade in the direction of the major trend whether it is up or down. It is always so much easier to go with the flow than against it. If one is a short term or day trader then this doesn’t apply to you.
There is an old expression that says, there is a bull market somewhere if you know where to look. The reason for that is because there are a lot of sectors that like to trade inversely to each other while one goes up the other goes down and vice versa. A good example would be how the PM complex generally trades inverse to the US dollar. We also know that the only rule when it comes to trading the markets is, there are no rules, which is why we sometimes see the inverse correlation not working very well which can go on for long periods of time.
For those investors that always trade the markets with fundamentals and hard fast rules, that if this area goes up, the corresponding sector will have to go down and will never be able to adapt to what the markets are really telling them. Keeping an open mind to any possible scenario will ensure that you will at least have a chance to be successful in the long haul.
The reason I’m bringing this up right now is because we currently find ourselves in a very unique situation which very few investors realize right now. We have 2 secular bull markets taking place at the same in both the US stock markets and and the PM complex. Most precious metals investors believe that in order for the PM complex to go up the stock markets must crash and burn which is a fallacy. They can both go up or down together or they can trade inversely to each other.
There is another reason why I’m calling our present day investment environment unique which is because we can now add a 3rd sector to bull market status, commodities. Back in April of this year the commodity complex had its capitulation move to the downside by going lower than almost anyone could have imagined unless you were a member of Rambus Chartology.
There is also one more important reason why we are living in one of the most bullish times that I can think of in my investing career and it is strictly from the psychological point of view. Just think 2020. With everything that has happened this year the markets haven’t crashed but just the opposite with many sectors breaking out to new all time highs which is bullish not bearish. I see investors still wanting to short the stock markets thinking it just can’t keep going up. How can the markets keep going up when the fundamentals are so bad and how everything we see and hear tells us the world as we know it is coming to an end, yet the markets keep going up.
It is this kind of environment that keeps investors on the sidelines waiting for the all clear signal to jump in. That signal will eventually come but not until much further down the road when the parabolic move starts. Keep in mind the markets are forward looking so what you see taking place right now is not what the markets are seeing six months to a year or so in the future.
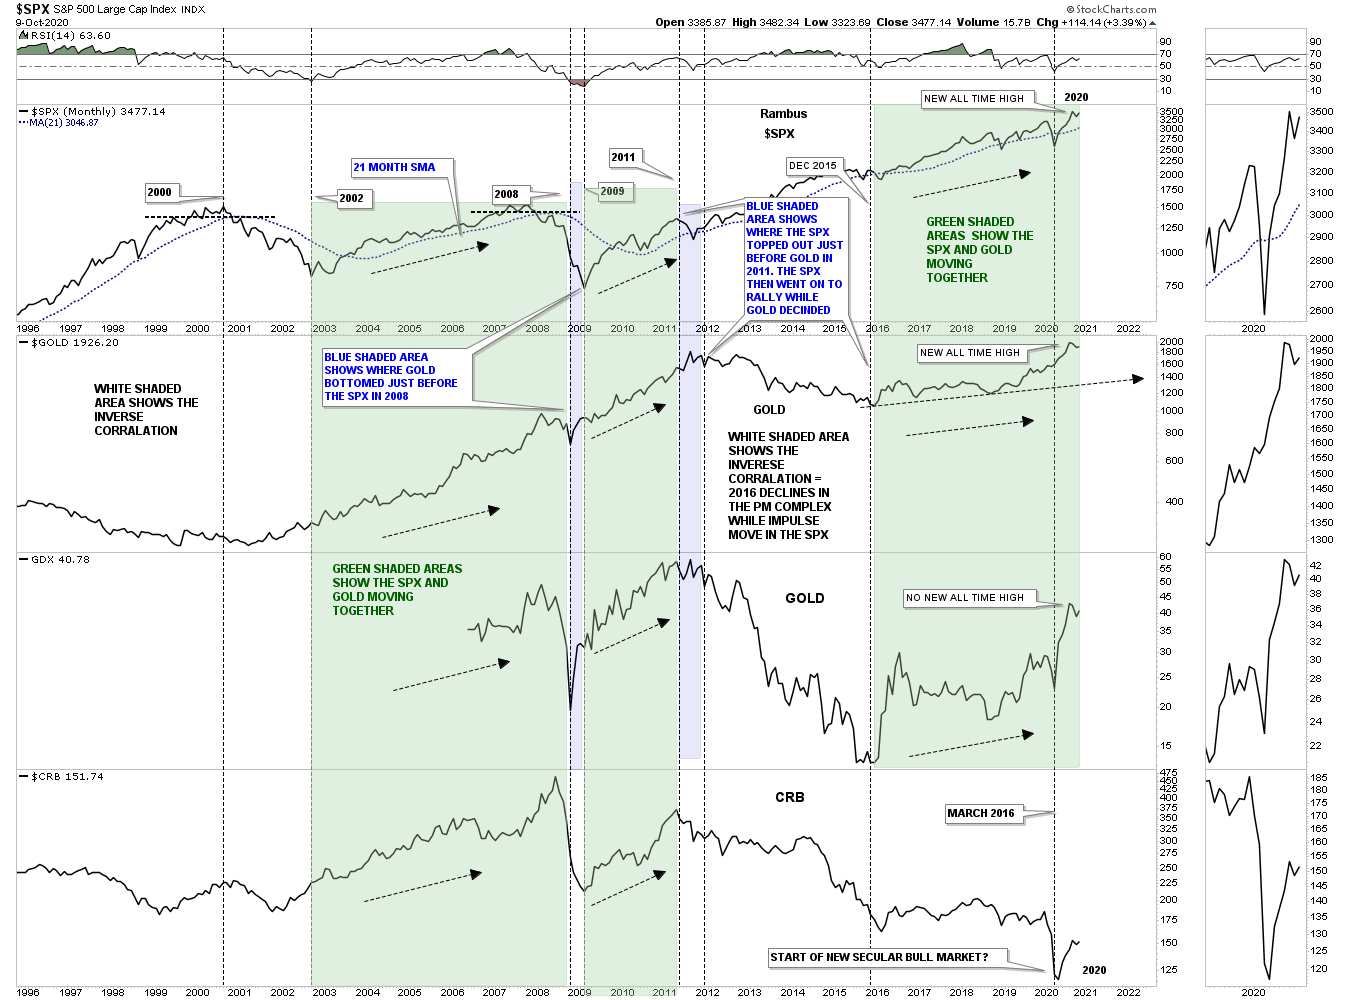
This first chart is the 25 year combo chart which has the SPX on top followed by gold, GDX with the CRB index on the bottom. As you can see the SPX and gold have just recently made new all time highs in their respective secular bull markets. The GDX is also in a secular bull market but hasn’t made a new all time high just yet. The CRB index at the bottom of this combo chart is still extremely early in its new bull market which is going to take some time before investors really start seeing the signs. Note how all 4 have been moving higher since their March 2020 crash low. Again, this is about as bullish an investing environment that I’ve ever seen with 3 separate bull markets going on at the same time.
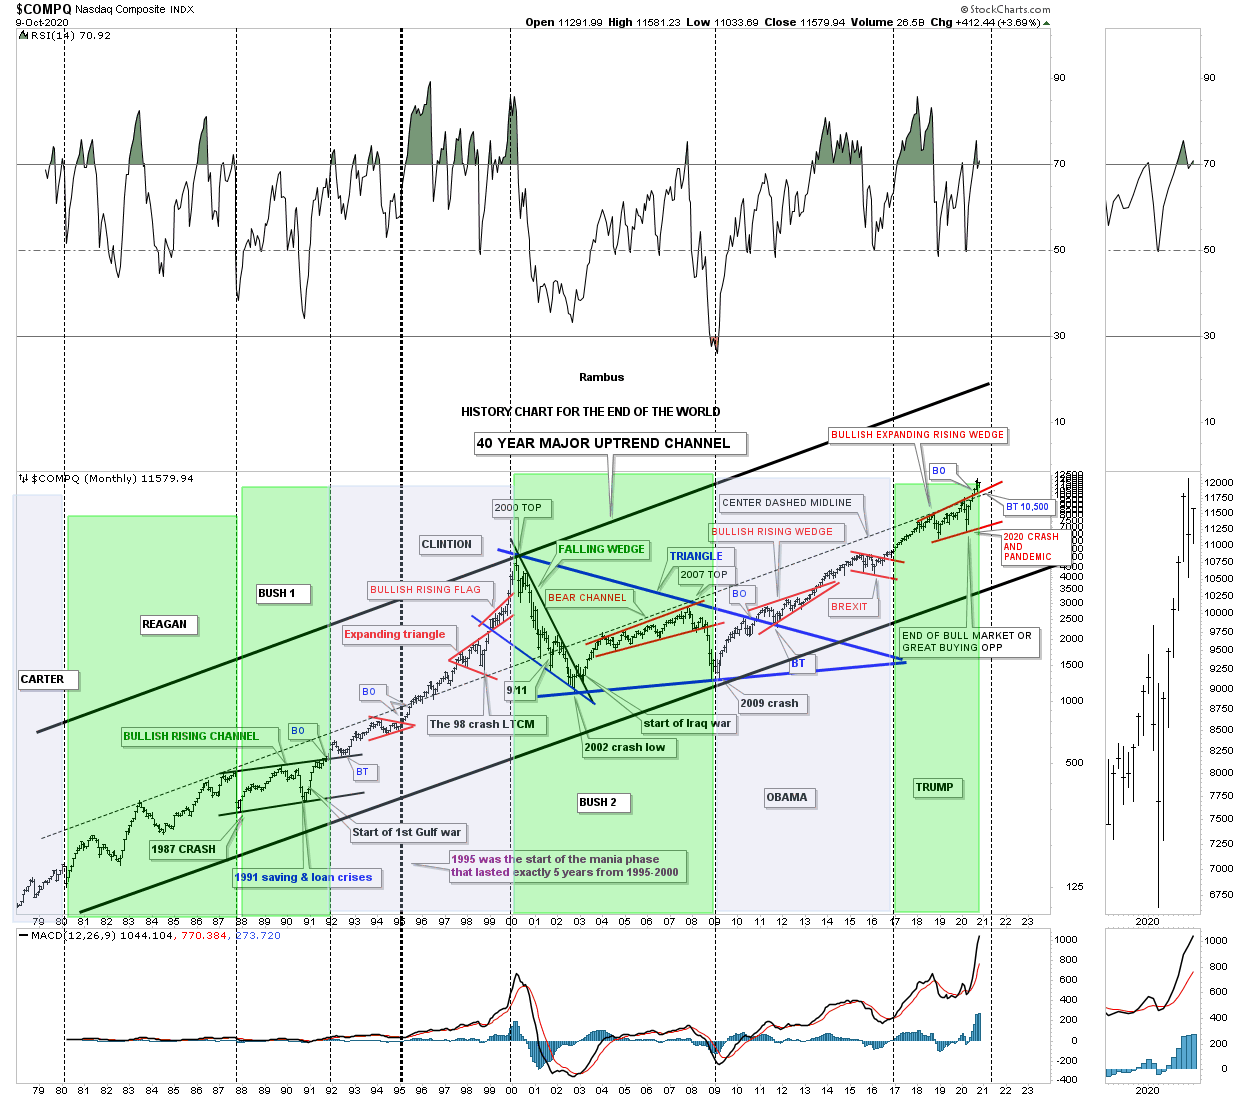
The big news right now is what is going to happen to the US stock markets after the presidential election is over? The answer to that question resides in this 40 year chart for the COMPQ which is a satirical look at all the end of the world events that felt like the end of the world if you were trading in real time while they were happening. Everytime there is an end of the world event I just add it to this chart to see what happens.
The last end of the world event I added to this chart is the 2020 crash. Shortly after the March 2020 crash low I labeled that low as , the end of the world or a great buying opportunity. So far it has been a great buying opportunity. The last time we looked at this chart I showed you how the center dashed midline had been holding resistance going all the way back to the early 2000’s and a move above that center dashed midline would be bullish as it has so much significance attached to it. As you can see the price action is now trading in its 3rd month above the center dashed midline making a new all time high.
As for the question on what will the stock markets do after the election results are in? It’s not going to make a bit of difference who is elected president. What matters most is if the stock markets are in a secular bull or bear market. The green shaded areas show what happened when a Republican was in office and the blue shaded area shows what happened when a Democrat was in office. For those that think if a Democrat is elected to office the world as we know it will come to an end because of all the negative fundamentals they perceive to have. On the other hand if a Republican is elected the bull market is already set in stone so he should have nothing to worry about in regards to the stock markets. It’s possible we could see a head fake shortly after the election like in 2016 when the US stock markets sold off hard for about a day or two before moving higher in that 2016 impulse move that lasted 2 years.
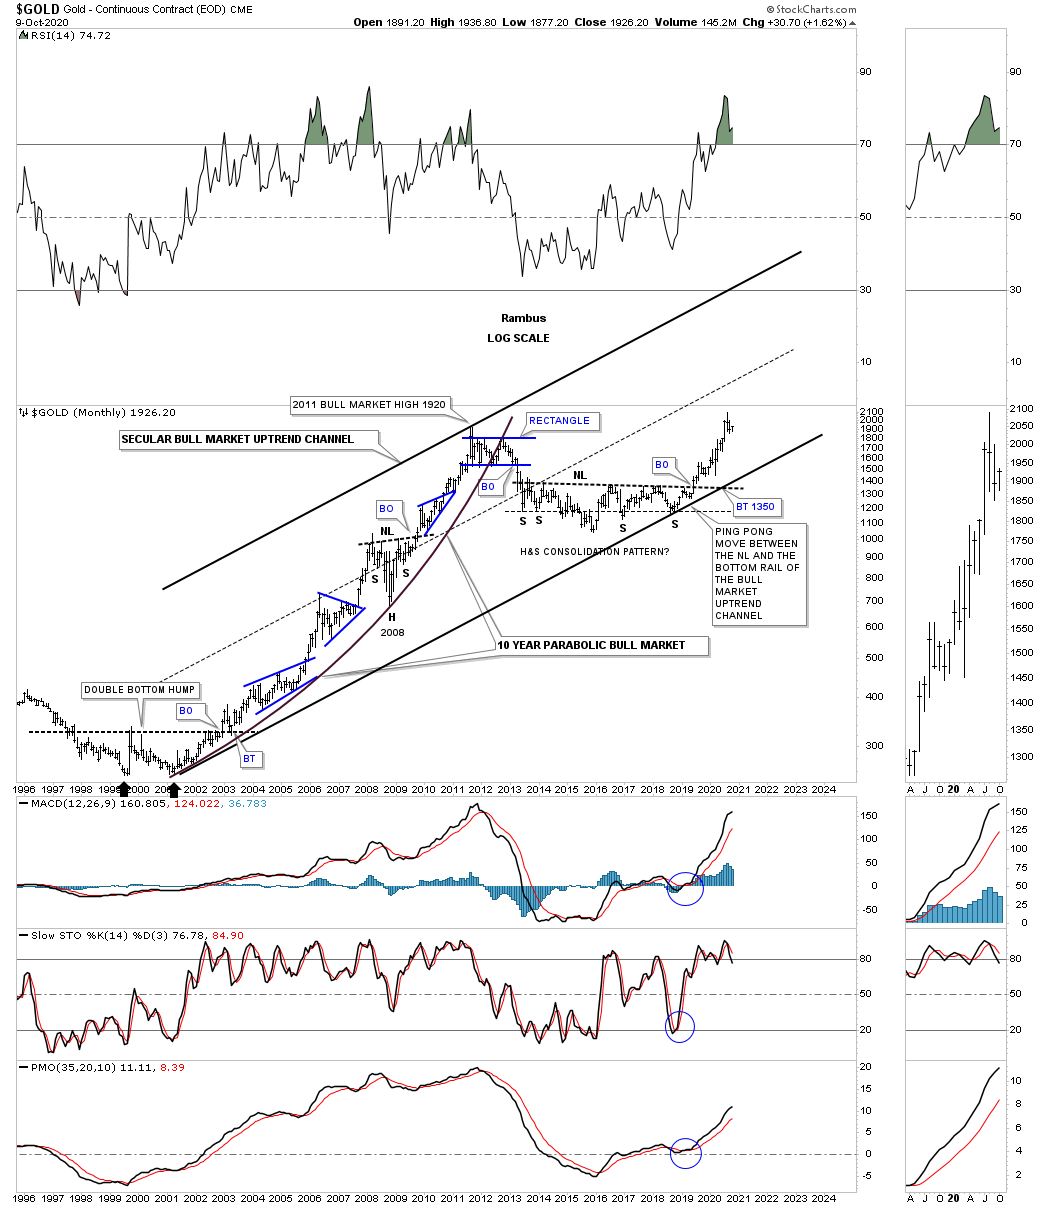
Let’s look at Gold’s secular bull market that began in 2000 which was a sight to behold until the top in September of 2011 when it was time to consolidate those gains. The first part of the secular bull market began when the price action broke out from a massive double bottom reversal pattern complete with a backtest to the double bottom trendline. The first part of our current secular bull market was born from the right side of the double bottom reversal pattern which was followed by one consolidation pattern forming on top of the previous one. This is what your typical bull market looks like nothing more of nothing less.
That part of the secular bull market consisted of 4 consolidation patterns, 2 bullish rising wedges, one triangle and one beautiful and symmetrical H&S consolation pattern that formed at the 2008 crash low. The cyclical bear market began at the 2011 high and lasted from my perspective, until the price action broke out above the neckline in June of 2019. How many still remember the neckline at the 1350 area that seemed like it would never be broken to the upside? You can see the breakout move was very strong and didn’t even have time for a backtest which in and of its self is bullish.
This next chart for gold is a long term 30 year quarterly bar chart which compares our current multi year H&S consolation pattern to the big double bottom based that launched the first half of the secular bull market. Big bases lead to big moves.
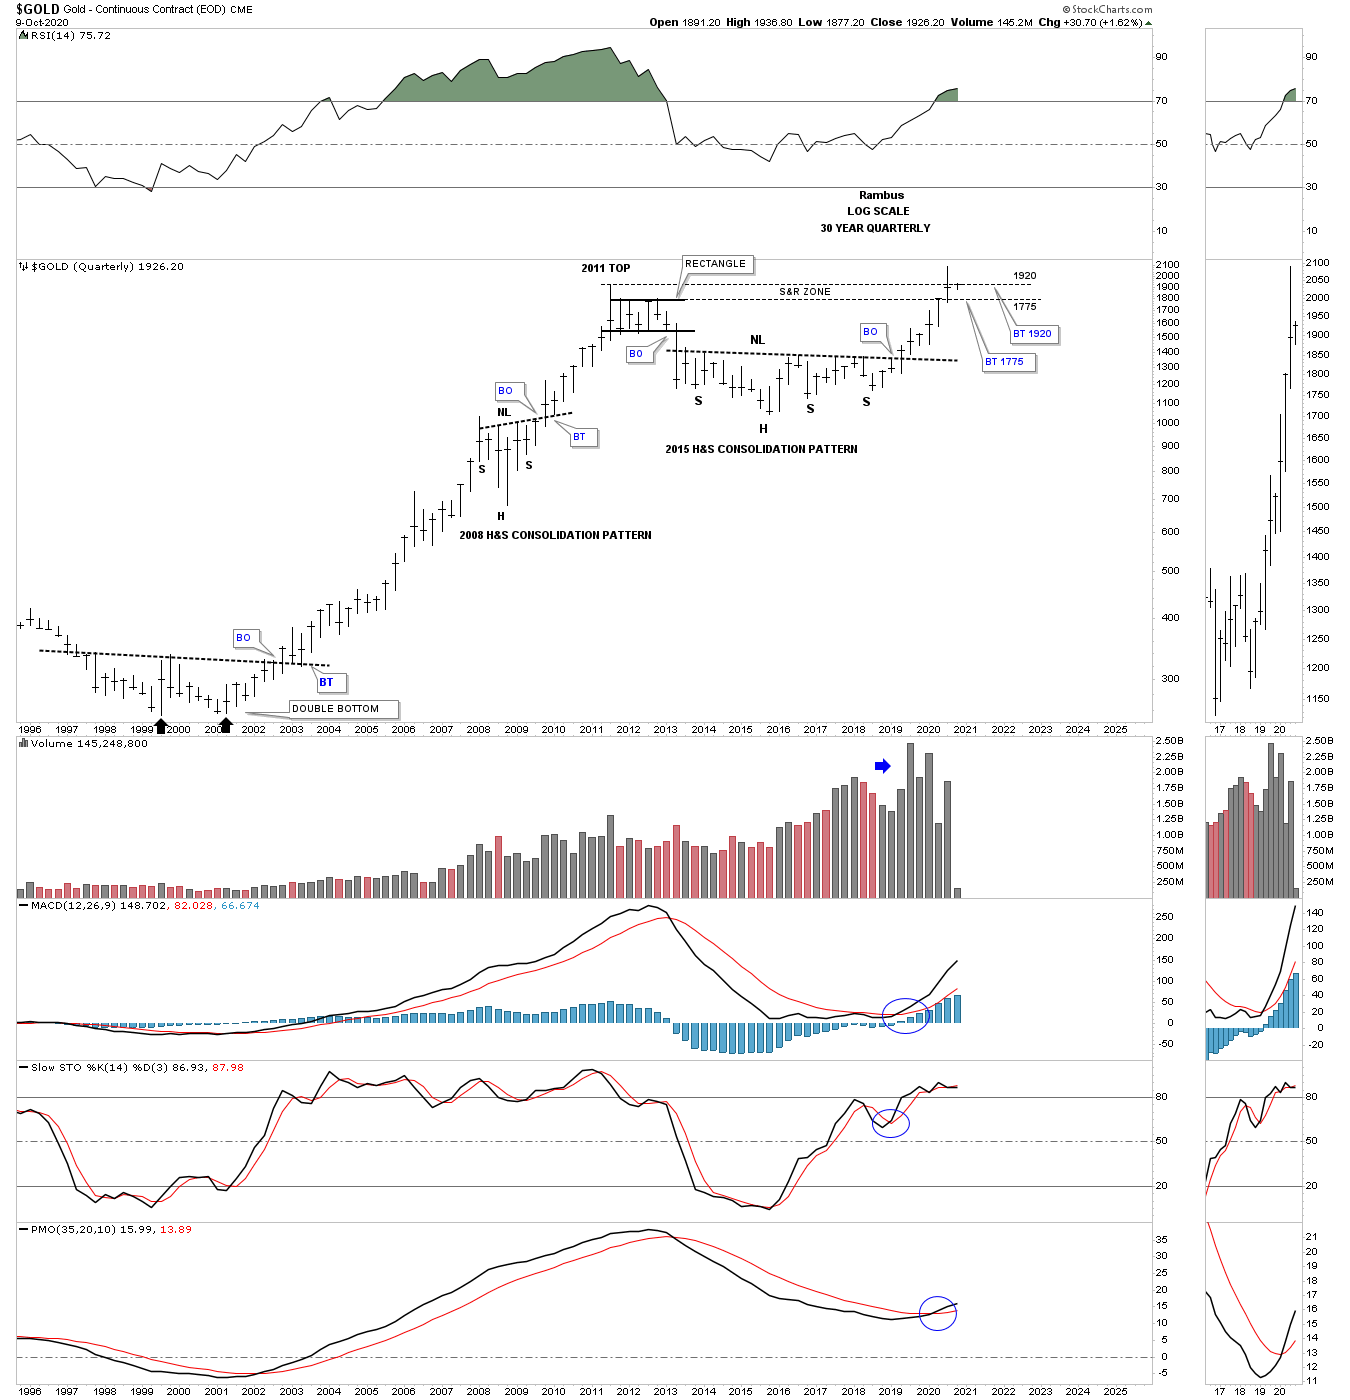
Below is a weekly bar chart I call the reverse symmetry chart, which shows you a good example of reverse symmetry and how gold came down during its bear market years is how it’s going back up over the same area as shown by the blue arrows. The other important feature on this weekly chart is how the price action continued to make higher lows and higher highs into its 2011 high. Looking at the bear market that began in 2011 you can see how the price action made lower lows and lower highs until the head was formed back in December of 2015. From that 2015 cyclical bear market low Gold has formed a series of higher highs and higher lows which is what you want to see take place during a bull market. That massive H&S consolidation pattern fulfilled its minimum price objective at 1775.

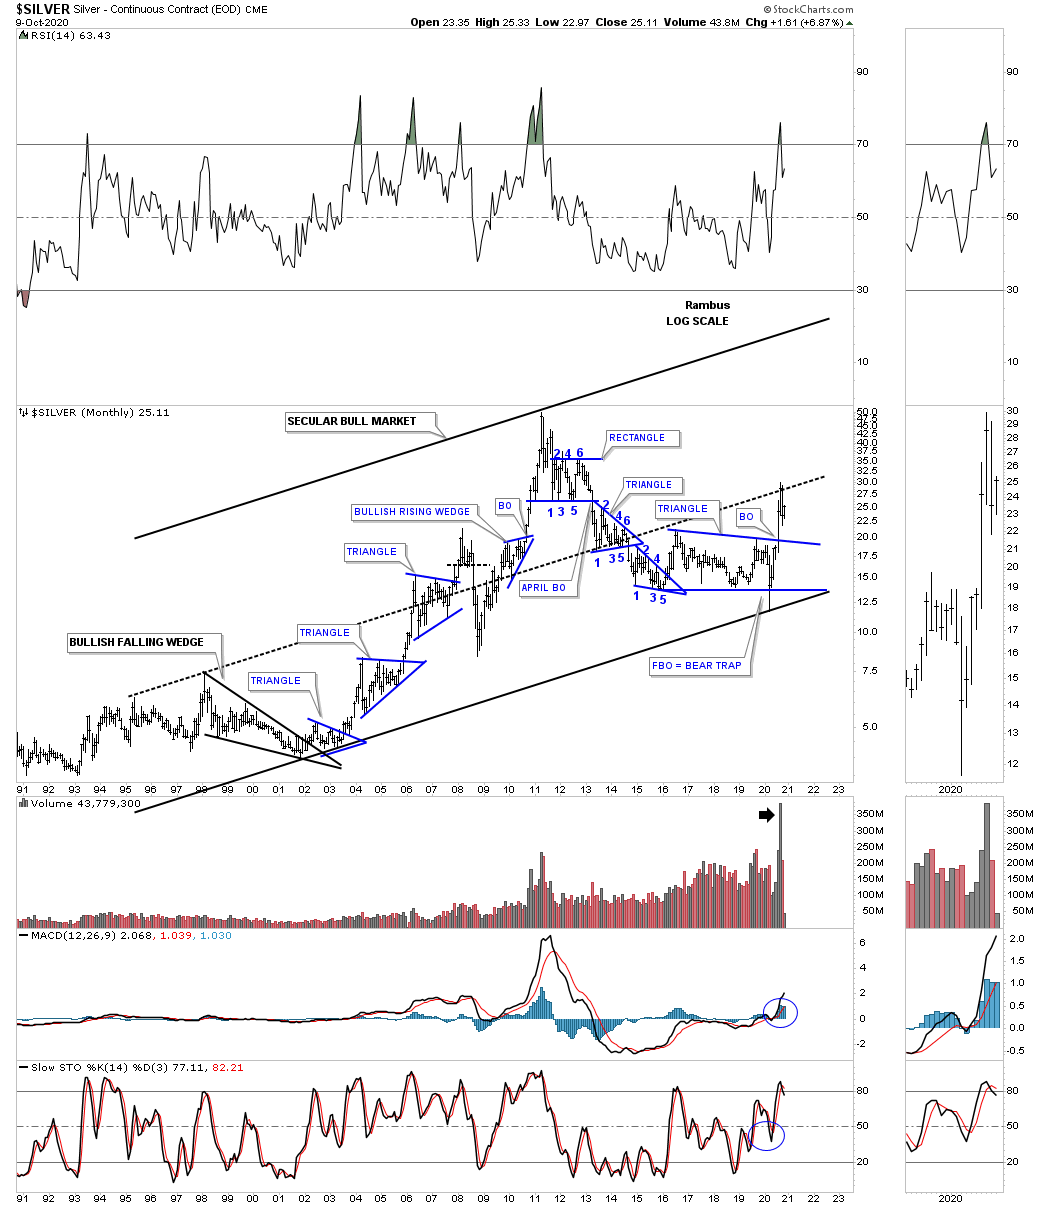
Next let’s look at a 30 year monthly chart for silver which shows its secular bull market. Unlike gold which made a new all time high recently silver still has a long ways to go yet before it reaches its all time high at fifty. Note how the center dashed midline held resistance on the initial hit 2 months ago telling us the center dashed midline is still hot and to be respected. Also note the huge volume that formed during the breakout move from that 2016 triangle.
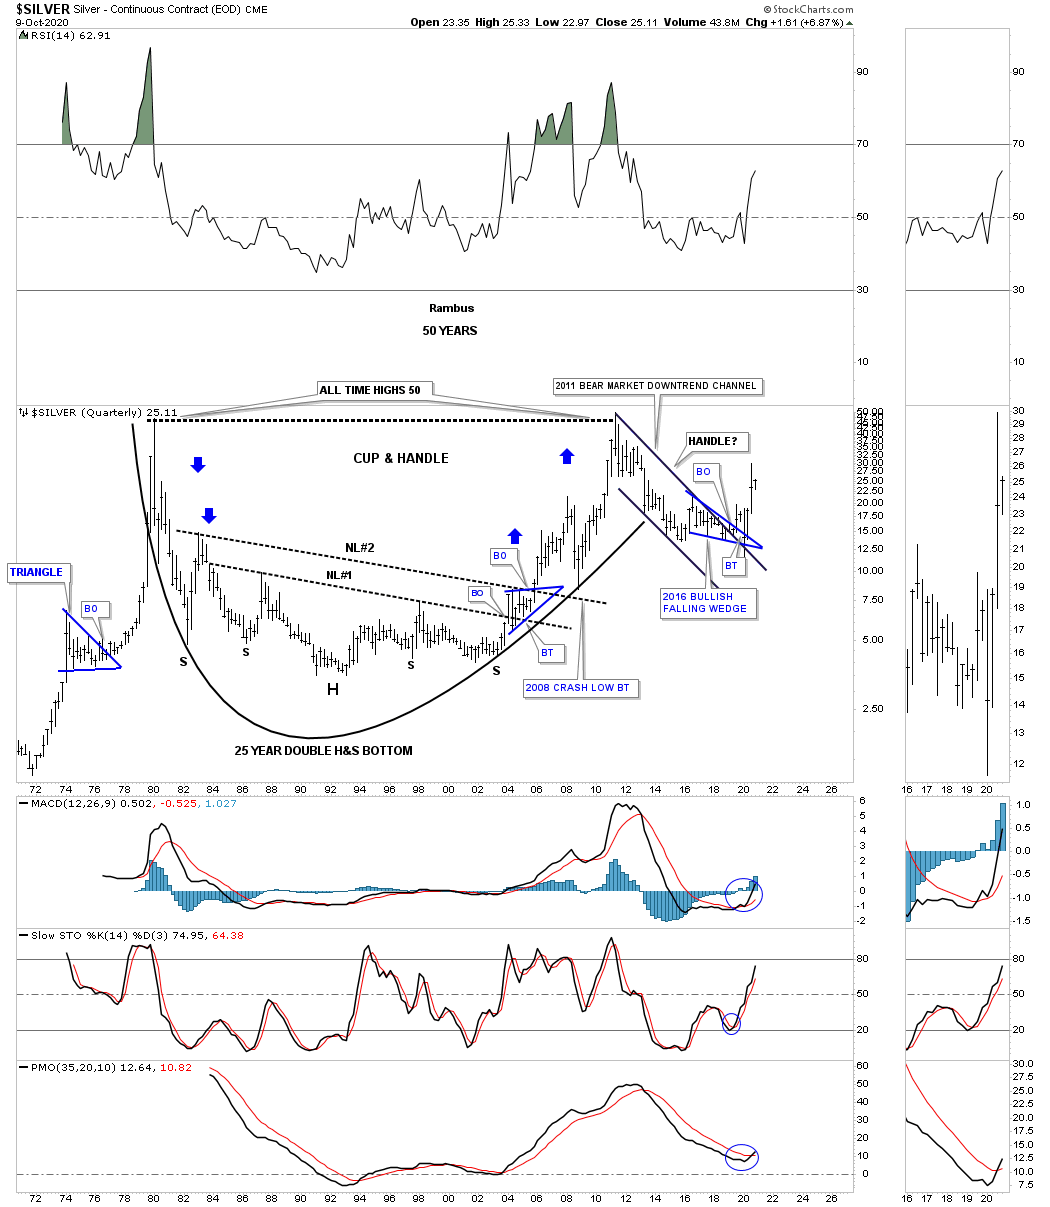
This next long term chart for Silver shows its potential very bullish setup with the possible massive cup and handle formation where the 2011 bear market downtrend channel has formed the handle. This chart also shows you some nice reverse symmetry as shown by the blue arrows even on this very large timescale. The cup was made from the double H&S bottoms with each neckline being backtested from above.
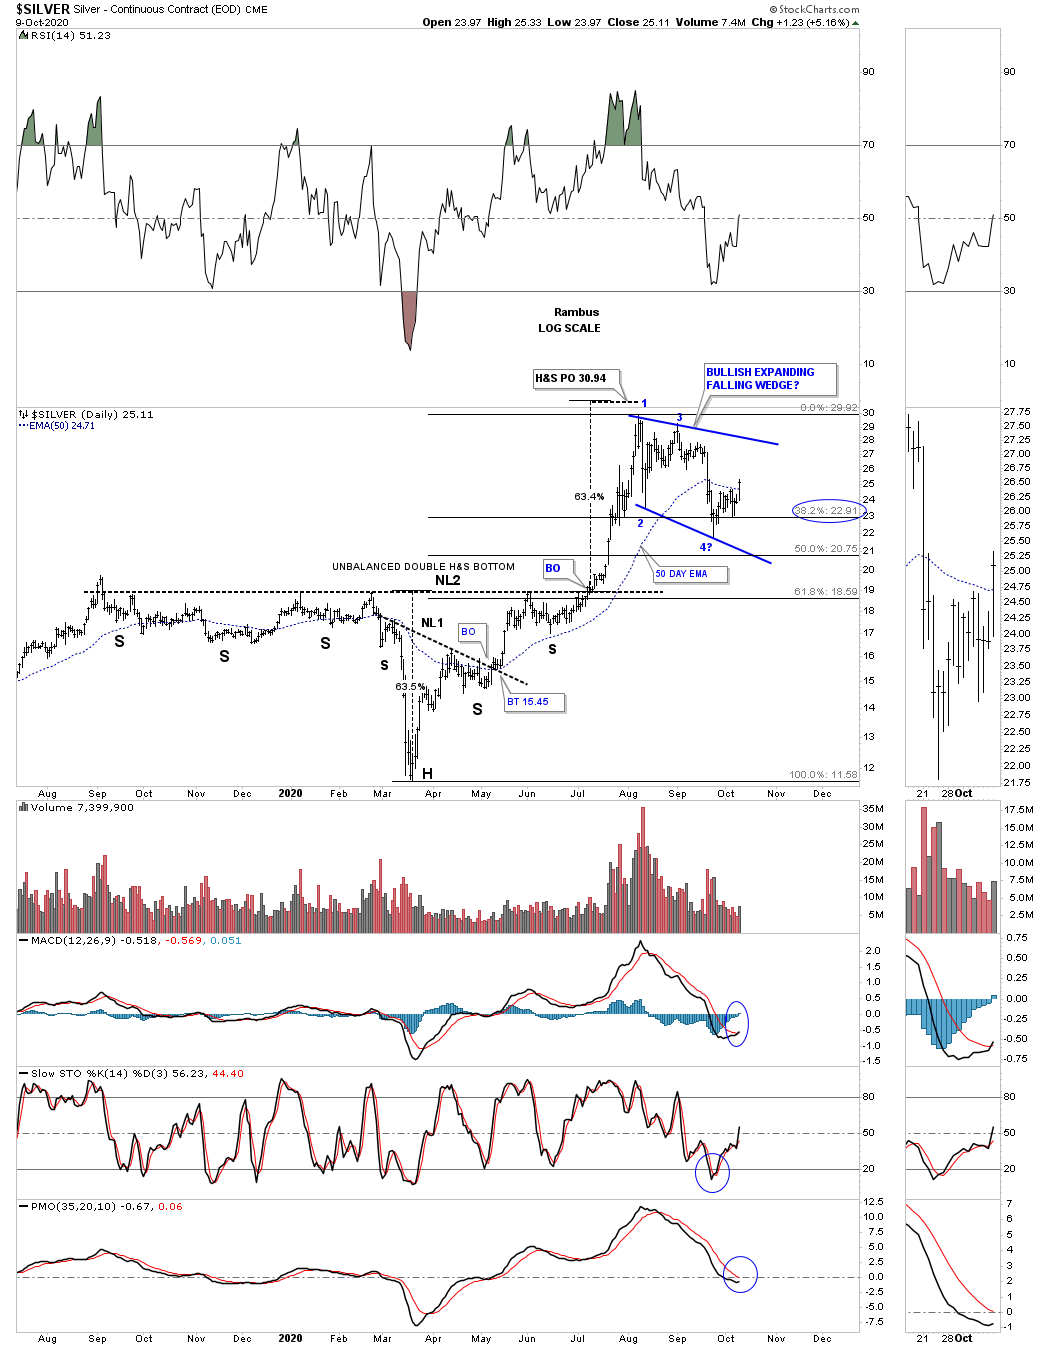
For close to a year silver craved out an unbalanced double H&S bottom that had a big left shoulder and a small right shoulder. The price objective for that double H&S bottom ended up being slightly higher that the August high. Currently it appears that silver is building out the blue expanding falling wedge with the last reversal point being between the 38% and 50% retace of the entire March 2020 rally.
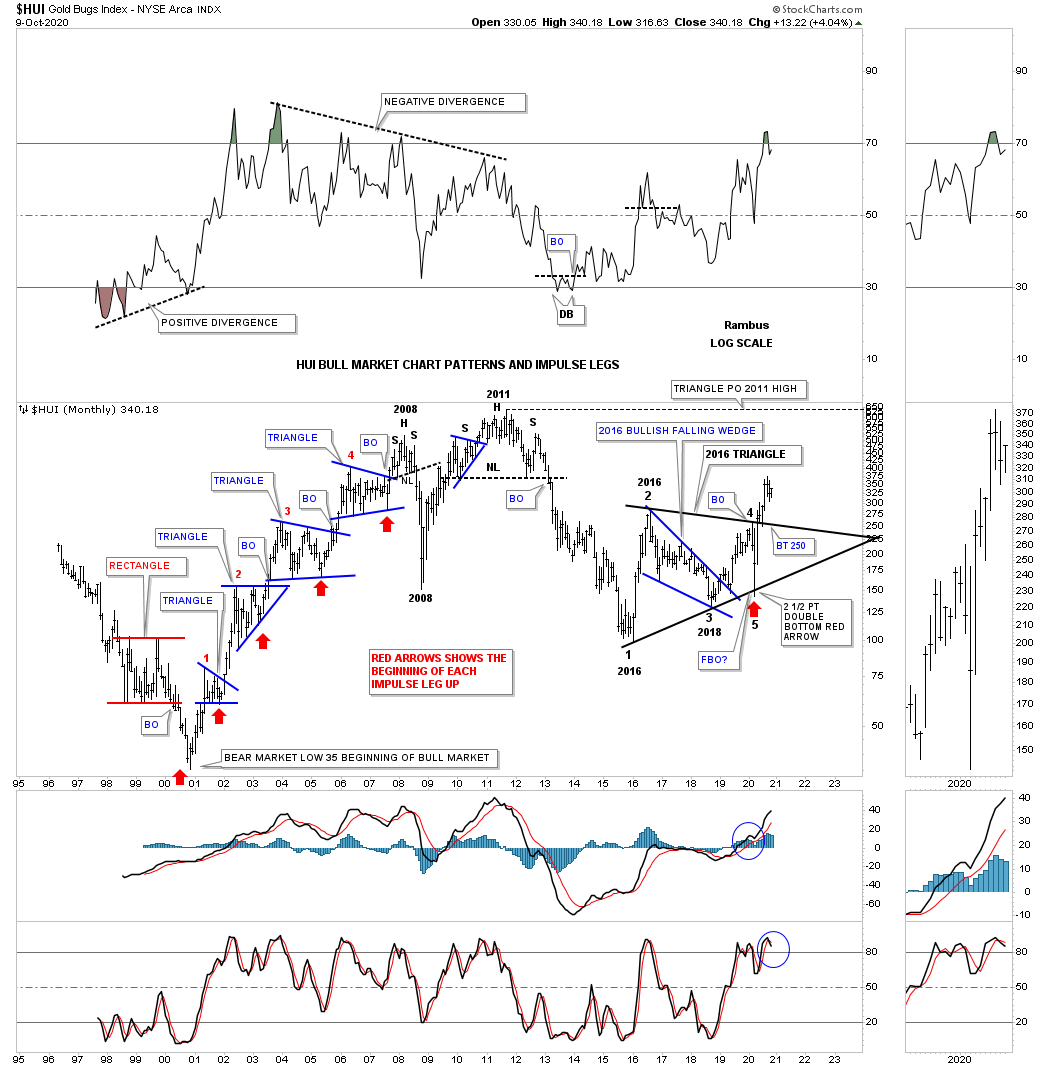
Let’s finish up by looking at some long term charts for the HUI. This first chart is a long term history chart which shows every consolidation and reversal pattern the HUI has ever made. During the bull market years you can see one consolation pattern forming on top of the previous one with the red arrows showing you the beginning of each impulse move. How would you have reacted if you found yourself in any of those blue triangle consolidation patterns? Could you have hung on to experience the next impulse leg higher? I can tell you it always looks easier in hindsight than in real time.
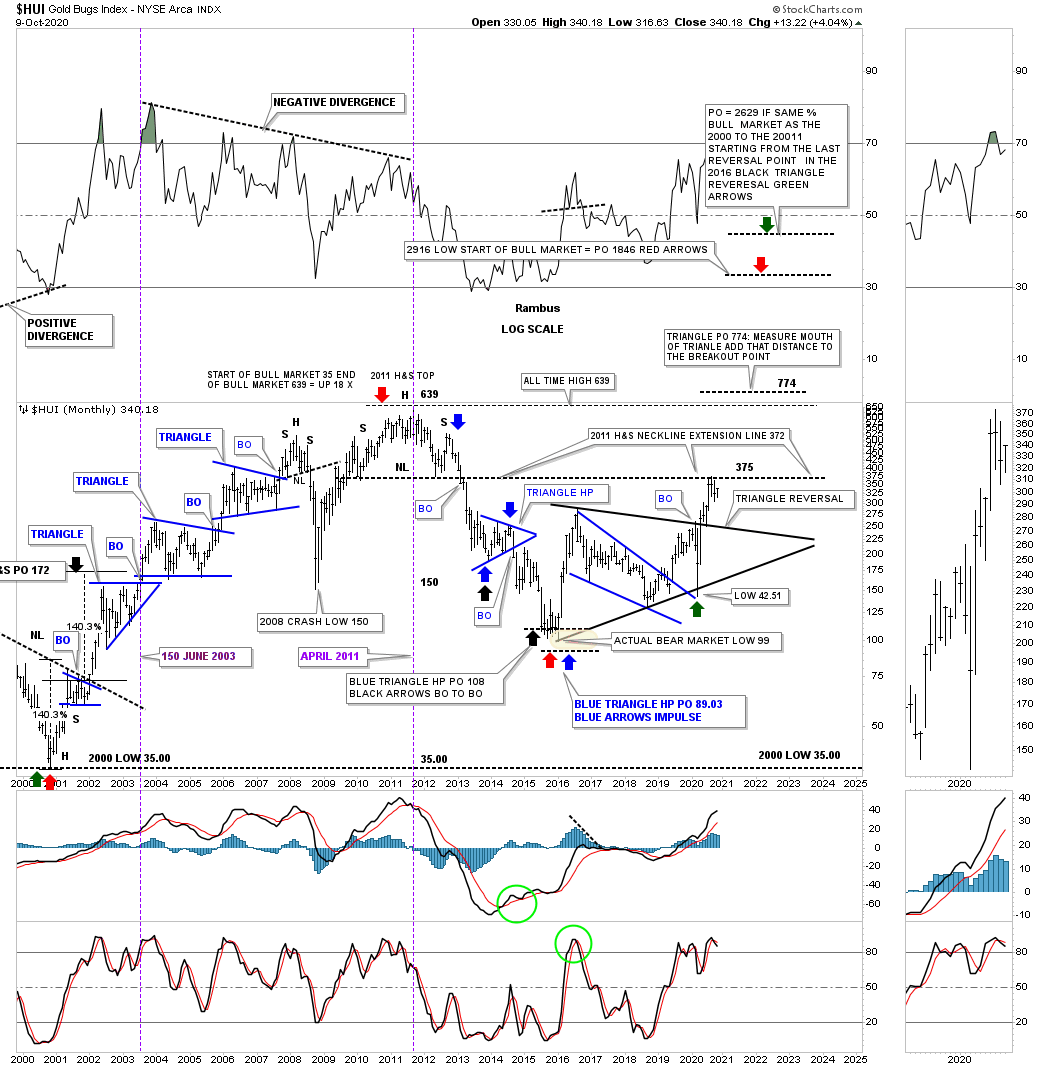
Since we looked at gold and silver’s secular bull markets, below is the secular bull market for the HUI. One important clue that suggested it was time to start accumulating PM stocks was the last touch of the bottom rail of the secular bull market uptrend channel which was also the bottom rail of the 2016 triangle reversal pattern. The last time we looked at this chart the 2011 H&S top neckline extension line was still holding resistance at 375. The HUI is the only PM stock index that has failed so far to trade above its 2011 H&S neckline extension line.

This last chart for tonight is one I built a while back which shows many of the different price objectives as shown by the colored arrows. Extrapolating into the future by what this chart is currently giving us you can see some potential price objectives down the road which may come into play with the first one being the neckline extension line at 375. If you measure the mouth of the 2016 triangle reversal pattern we get a price objective just above the 2011 all time high around the 744 area. There are a couple of much higher price objectives but for now we’ll take them one at a time.
In the Wednesday Report we’ll look at the other secular bull market that is taking place in the US stock markets and the new bull market that is just now starting in the commodity complex. Have a great rest of the weekend. All the best…Rambus
Quarterly Report Commodity Sector… Part 1
With the unprecedented amount stimulus going into the economy many investors are wondering if it will bring on inflation. So far all the stimulus from the 2008 crash to the present hasn’t had much of an impact on the inflation rates as most commodities have been moving lower until recently. March 2020 will go down in the history books as one of the biggest inflection points the markets have ever witnessed. Most of the stock markets, PM complex, and many commodities put in an important low while the US dollar put in a major high.
Let’s start with the weekly chart for the US dollar which shows a possible horizontal trading range building out. The price action has completed 2 compete reversal points with the 3rd one now in progress. There are several different possible scenarios that could play out that we have to be aware of.
The first scenario could be that if the US dollar fails to make it all the way down to reversal point #4 and puts in a higher low we could see a triangle forming. If the US dollar does in fact declines to the bottom rail at reversal point #4 we could then see a possible rectangle building out if the bottom rails holds support. A possible 3rd scenario would be if the bottom rail at reversal point #4 fails to hold support and the US dollar breaks through to the downside we could see a rather large double top reversal pattern. For now these possible scenarios are just something for us to watch for.
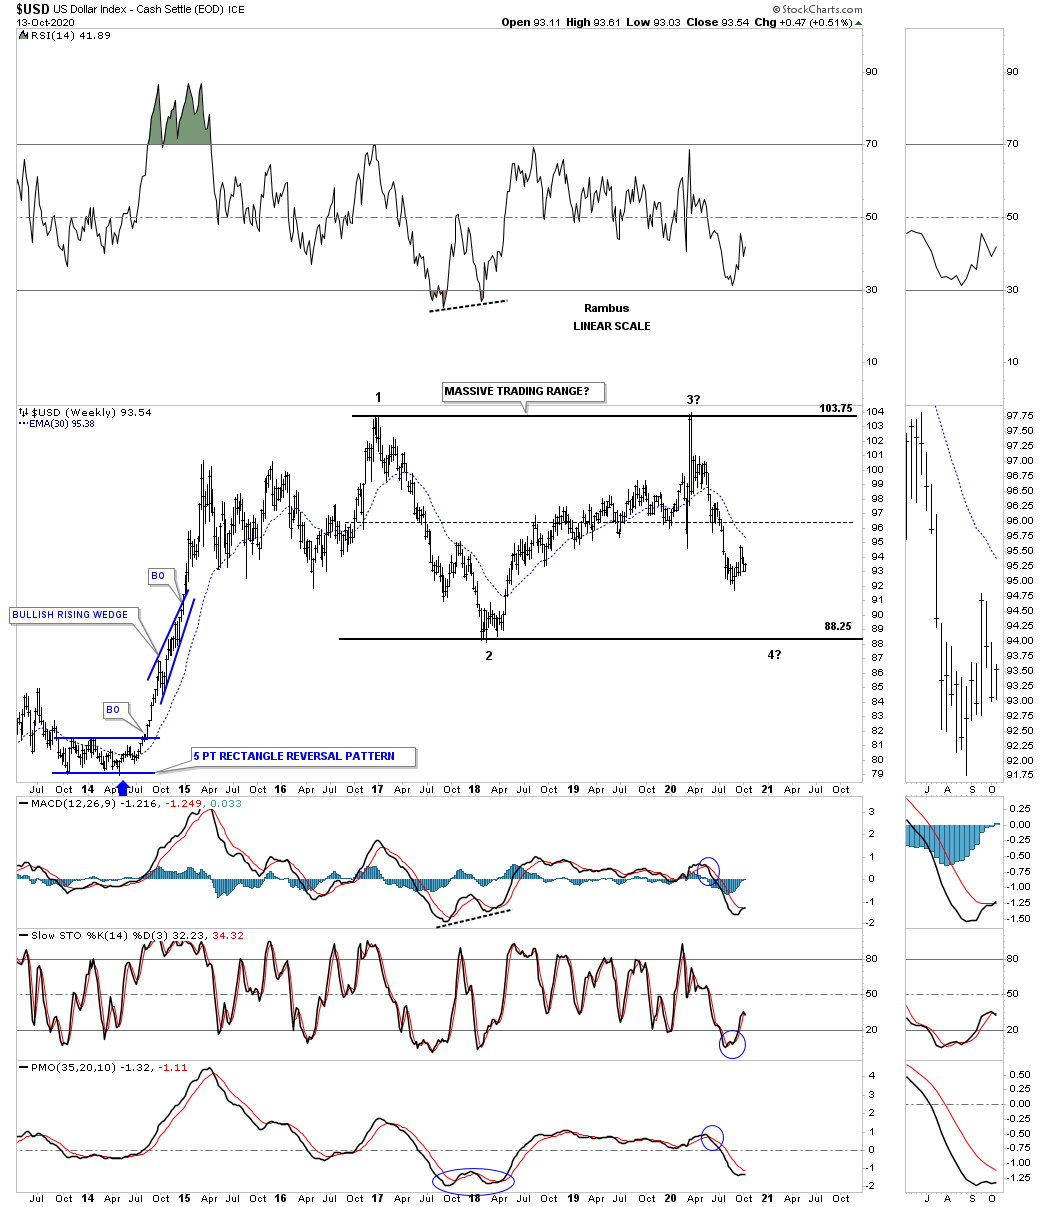
Next lets put the possible rectangle in perspective by looking at a 12 year weekly bar chart for the US dollar. The US dollar traded in the confines of that 2010 bull market uptrend channel until just recently when the price action broke below the bottom rail just 2 1/2 months ago in August. Three weeks ago the price action backtested the bottom rail of the major uptrend channel around the 95.0 area. What makes the bottom trendline so important are all the touches from the top side as it did its job of holding support. If you look at the right sidebar you will be able to see a small gap below the bottom rail of the uptrend channel which is hard to see but it is there. I’m also being pretty liberal with the backtest to the bottom rail which is really more like 95.00 or so. The bottom line is that I have to remain bearish on the US dollar until it can break back above the bottom rail to negate the breakout, below is bearish and above is bullish.
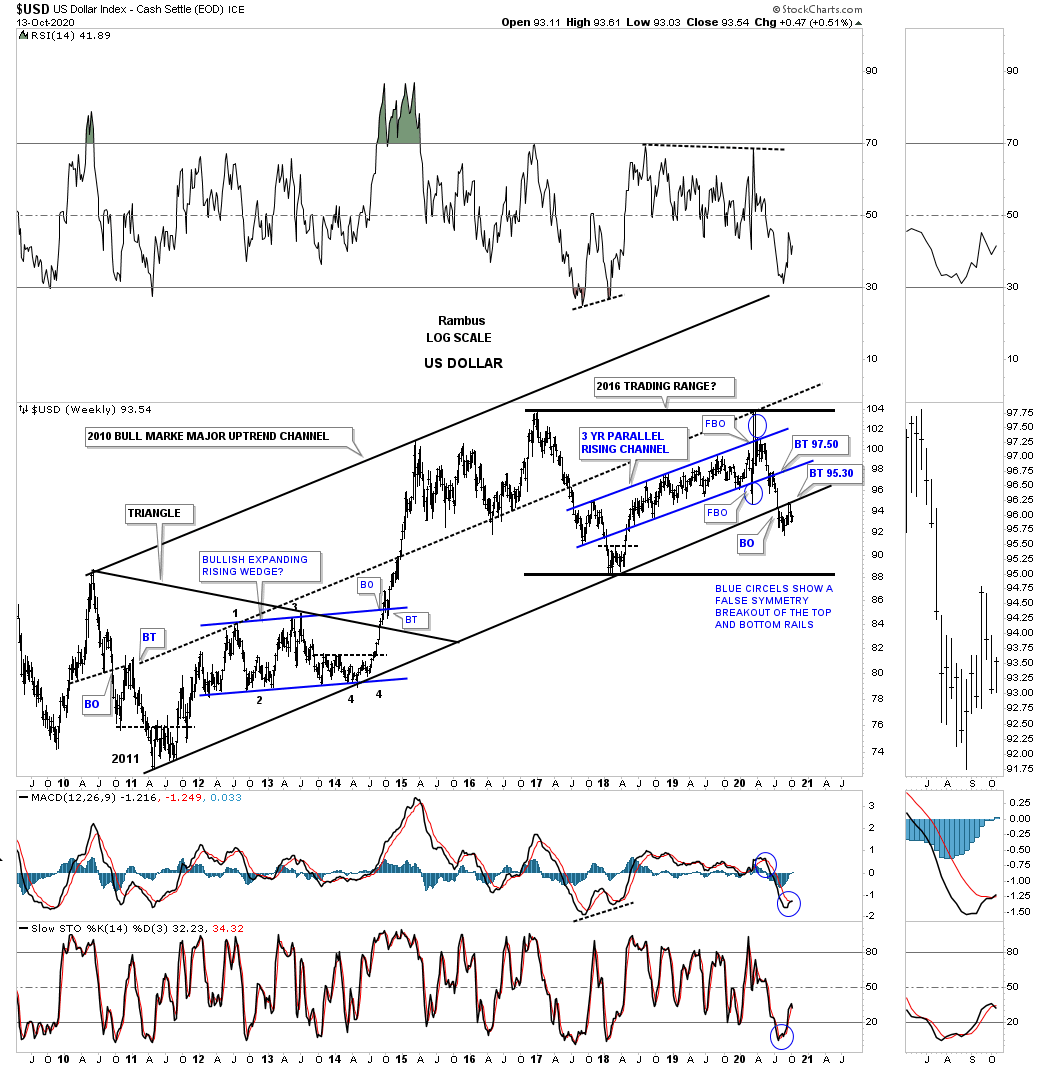
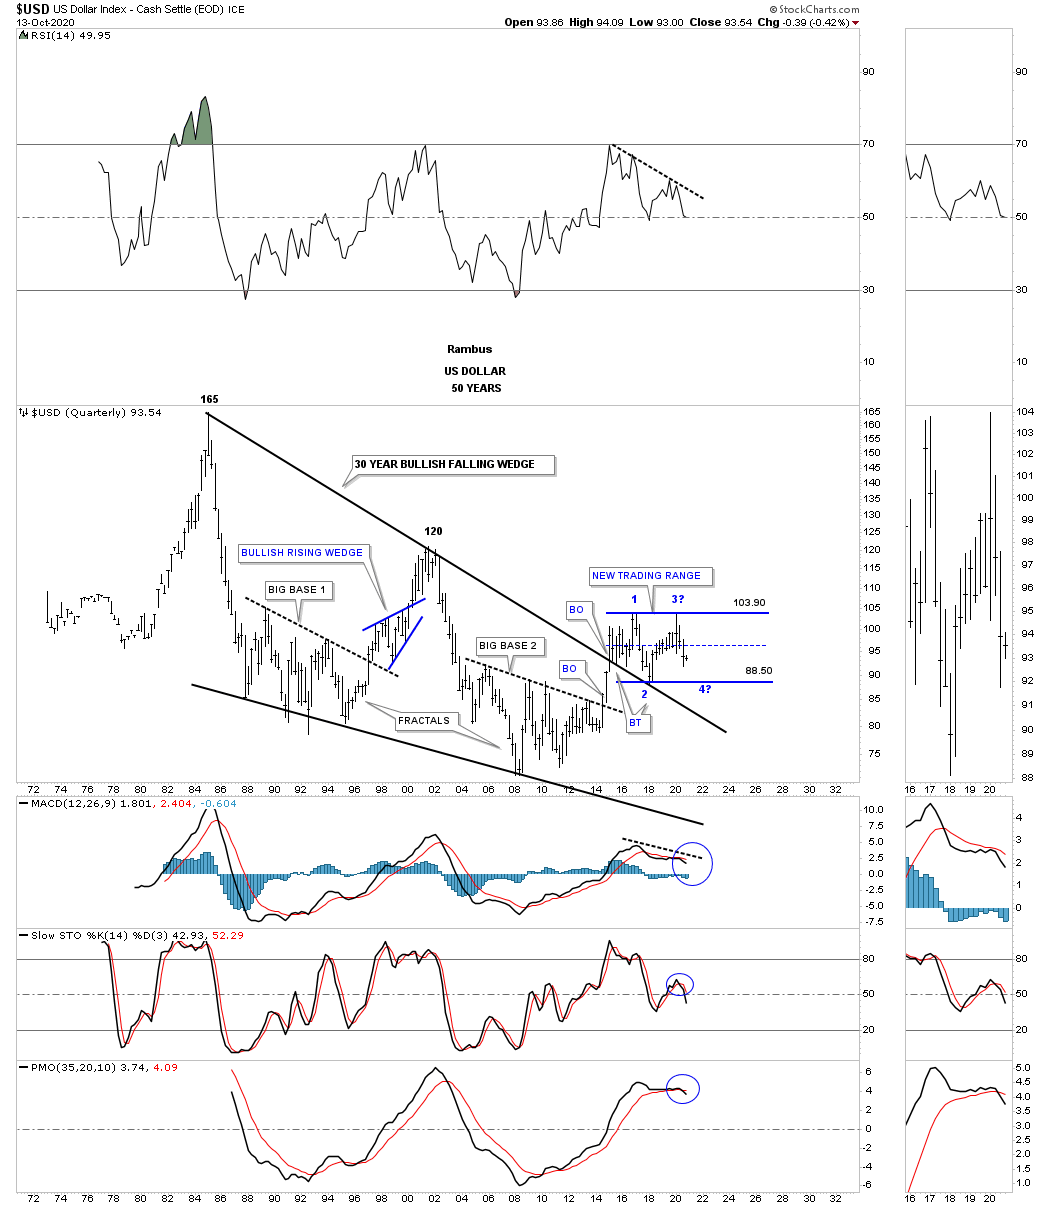
Lets really put that 2016 trading range in perspective by looking at the 50 year quarterly chart for the US dollar. If you were with us back in 2014 you should remember that massive breakout from big base #2 which was a fractal of big base #1, and the impulse move that followed. Even after all these years the top rail of the 30 year falling wedge has done its job of holding support. Again, what had been resistance turned into support once broken to the upside. From this perspective the US dollar is trading in no man’s land.
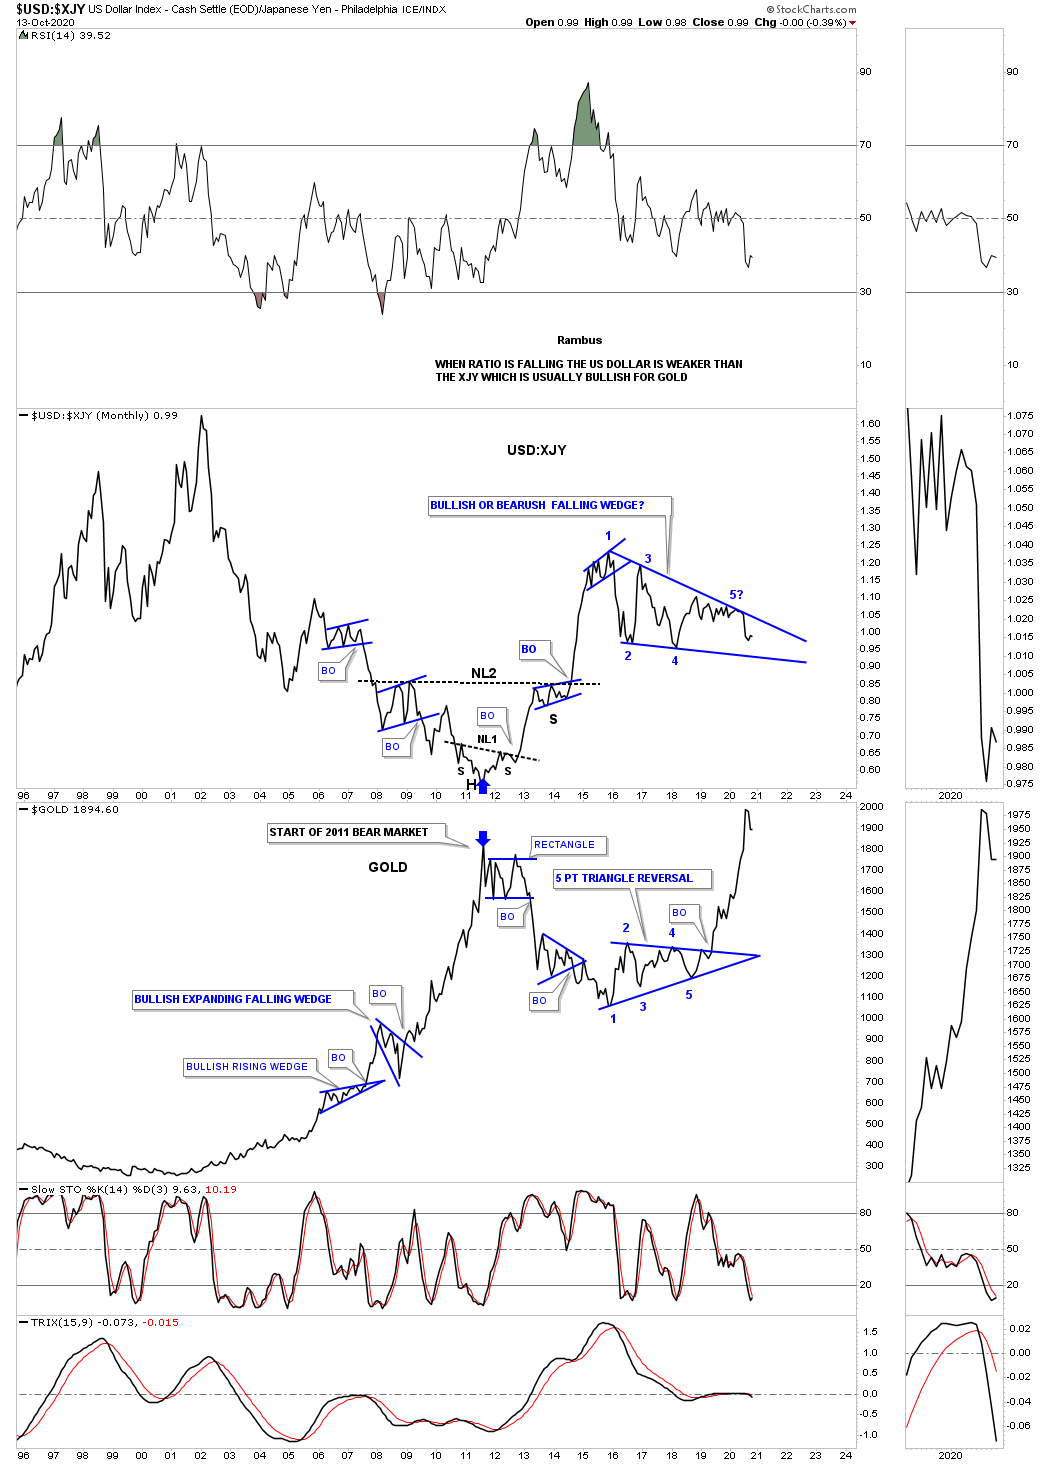
This next chart is a 25 year monthly line chart which has the USD:XJY ratio on top with gold on the bottom. When the ratio chart on top is falling that is bullish for gold because the XJY is stronger than the US dollar and vice versa. You may have noticed that gold on the bottom chart completed its 5 point triangle reversal pattern back in May of 2019 which led to the current impulse move. Looking at the ratio chart on top you can see there have been 4 completed reversal points with a possible 5th one underway to the bottom rail. If the ratio breaks below the bottom rail that would be a very bullish development for the PM complex.
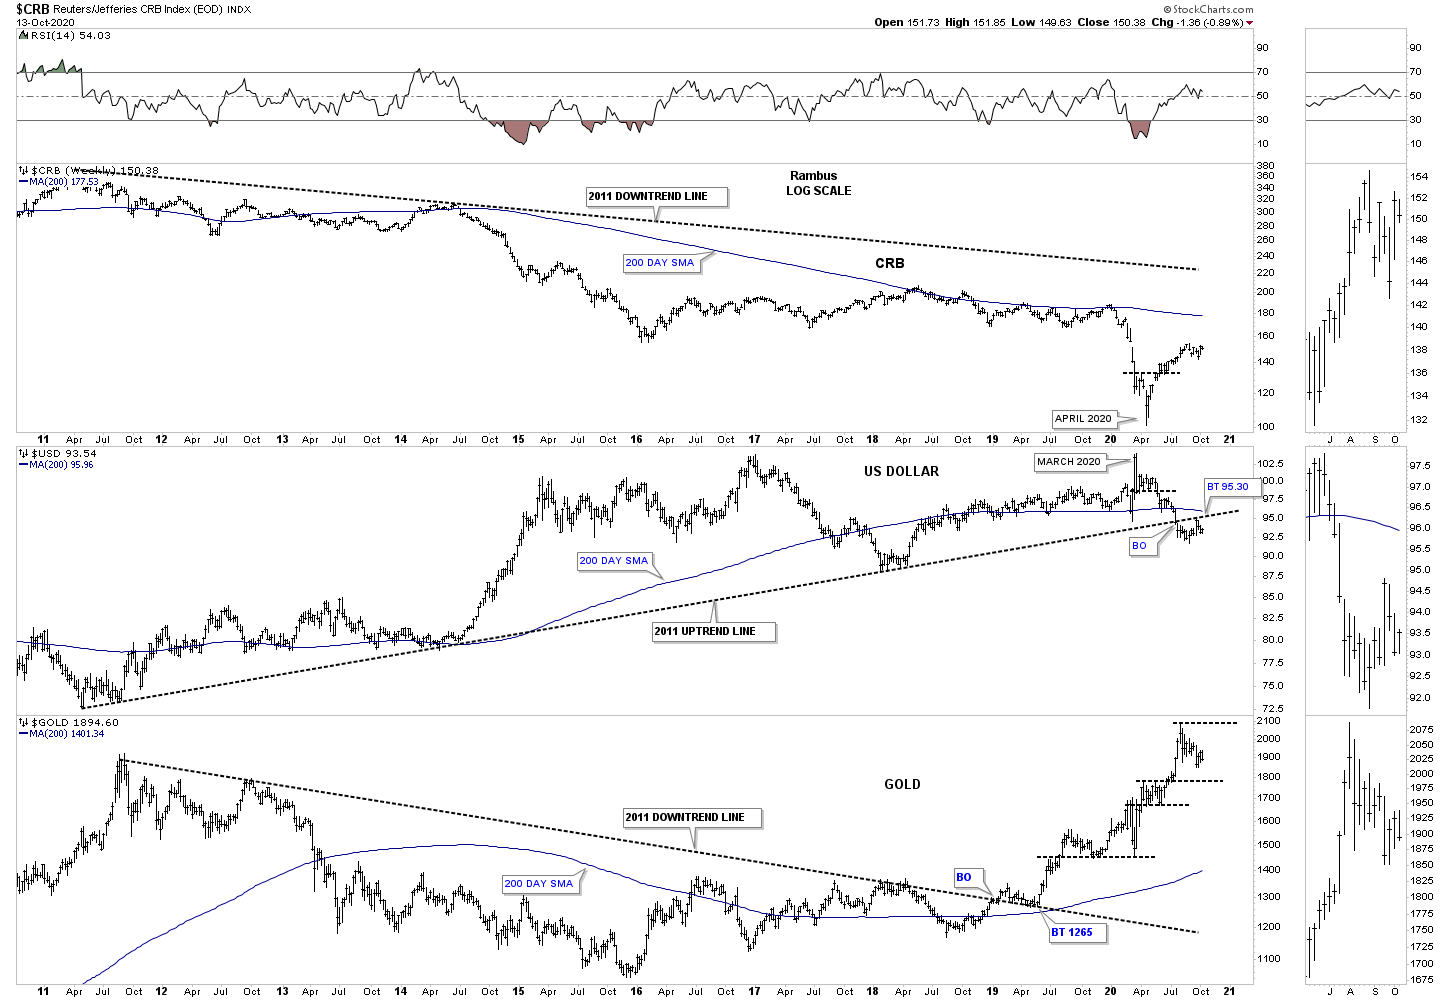
This last chart for the US dollar is the triple combo chart we’ve been following very closely which has the CRB on top, the US dollar in the middle and gold on the bottom. Back in March of this year you can see the US dollar was putting in its most recent high while the CRB index bottomed out a month later in April. Since that inflection point they both have been moving inversely to each other which should be bullish for commodities and the PM complex in general.
Quarterly Report Commodity Sector Part 2…
In part 1 of this in-depth report on commodities we analyzed the US dollar looking for clues to help give us some insight on what may lie ahead on the inflation front. Inflation as we know it has been pretty muted for a very long time. We’ve had some small bouts of it from time to time but nothing to get excited about. The last really serious bout of inflation that I remember was back in the 1970’s toward the end of the last secular bear market. That was also the time in 1980 that gold topped out at 870 and silver at 50 and interest rates were close to 20%. From that point on deflation has had the upper hand in general.
Normally during the end of a big move in a stock for instance, there will be a capitulation move where the price action can go parabolic that ends the move which can be on a short term scale or a very long term scale which is relative to the time scale you are looking at. These types of move can signal a new bull or bear market as well. Again, it all depends on what time scale you are looking at.
Tonight we’ll look at some long term commodity charts to see if they can give us any information regarding the inflation or deflation debate that seems to be on a lot of investors minds right now especially with all the stimulus being pumped into the economy. Being able to spot a major trend change early on can help us get on the right side and hopefully take full advantage of what of the situation presents to us.
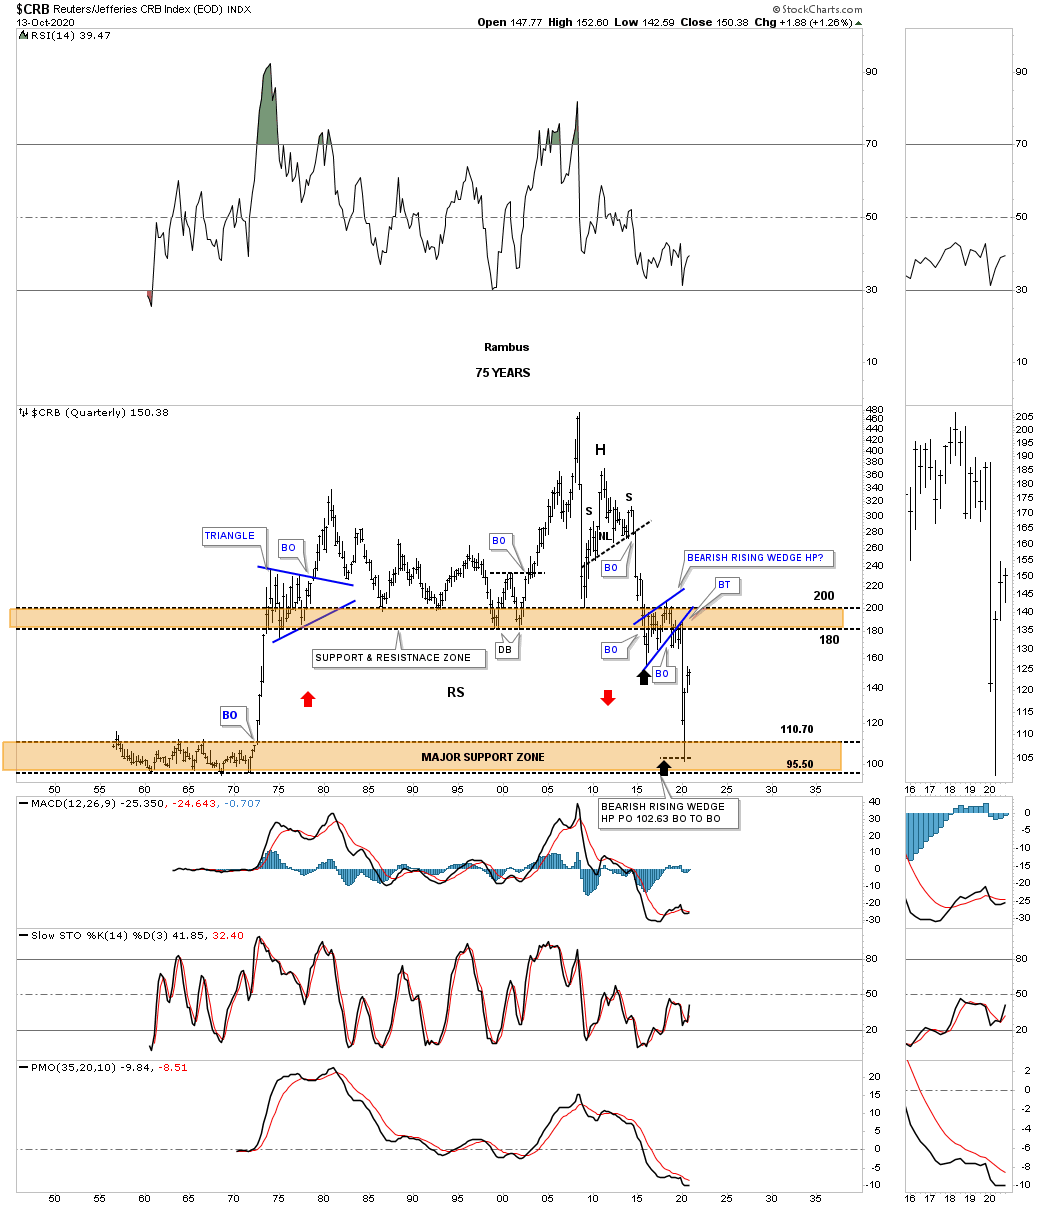
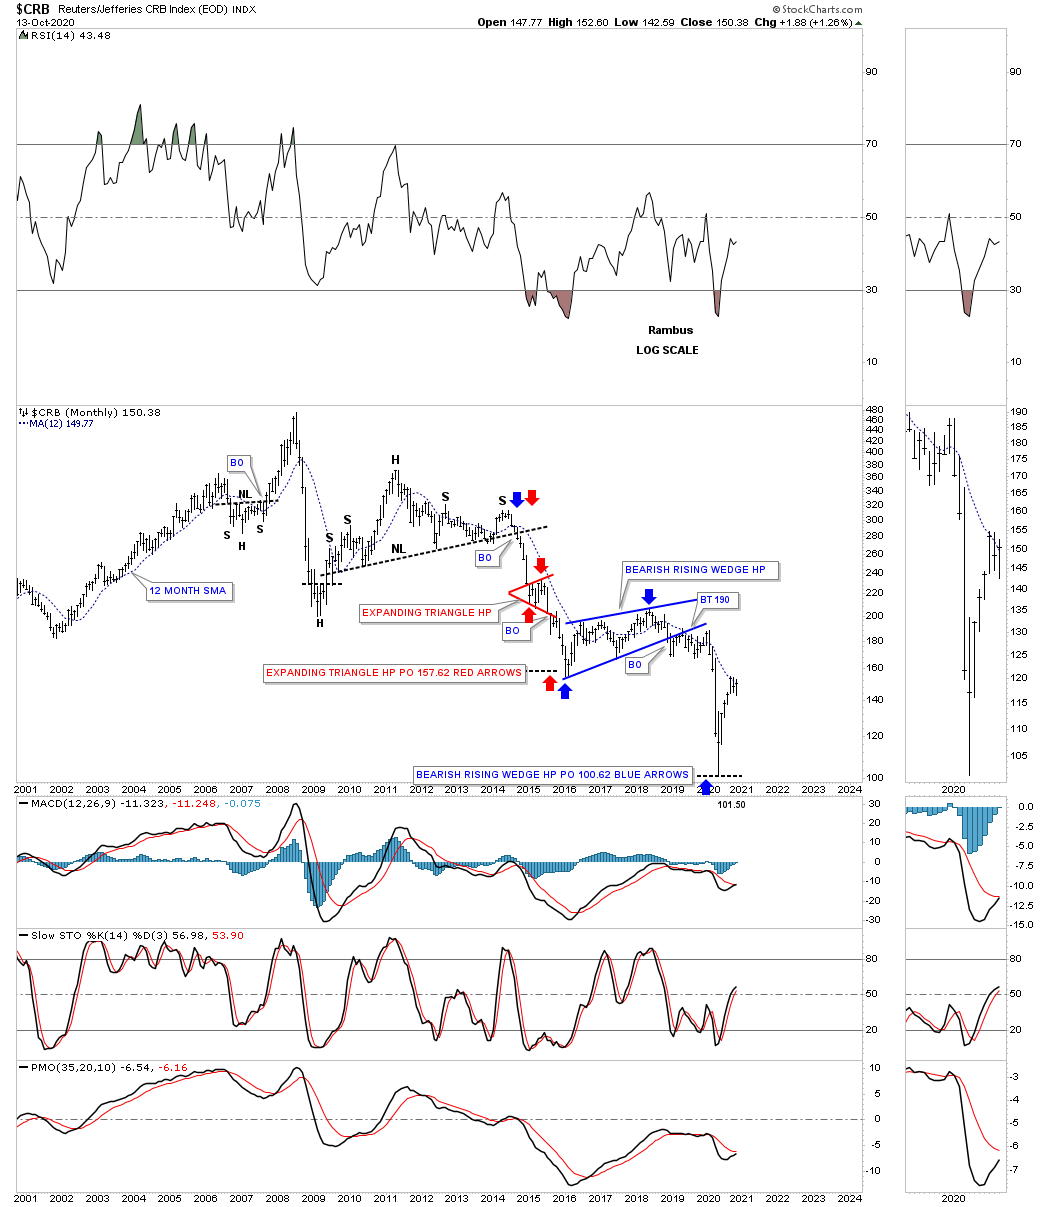
I have a ton of charts to show you tonight so lets get right to it keeping in mind what we discussed above about a possible capitulation move. Instead of starting out with the short term charts and working our way out to the longer charts I’m going to start with the quarterly chart for the CRB index first. Keep in mind most of the long term quarterly charts you will see tonight were originally built in 2014 in anticipation of that particular deflationary event.
What led us to believe that some type of deflationary event might come our way is when that 5 year H&S top completed in October of 2014. At the time of that impulse move down we were looking for the upper brown shaded S&R zone to hold support which it did after a strong test. As you can see the price action then backtested the S&R zone from below and formed the blue bearish rising wedge halfway pattern to the downside. This is the exact same original chart I built back then where I also showed how the CRB index could reverse symmetry to the downside over the same area on the upside in the 1970’s, red arrows. I was probably the only person on the planet that thought the CRB index could fall that low and the way it got to that low. Only possible through Chartology.
The blue bearish rising wedge halfway pattern had a price objective down to the 102 area based on the breakout to breakout method. The breakout to breakout method measures from the breakout of the H&S neckline to the first reversal point in the blue bearish rising wedge, black arrow. You take that distance and add it to the breakout point on the bearish rising wedge to get your price objective at 102. If a stock or in this case the CRB index ever had a look of capitulation this 75 year quarterly chart definitely does.
This next chart for the CRB index is a 20 year monthly chart which shows how the different price objectives were hit as shown by the colored arrows.
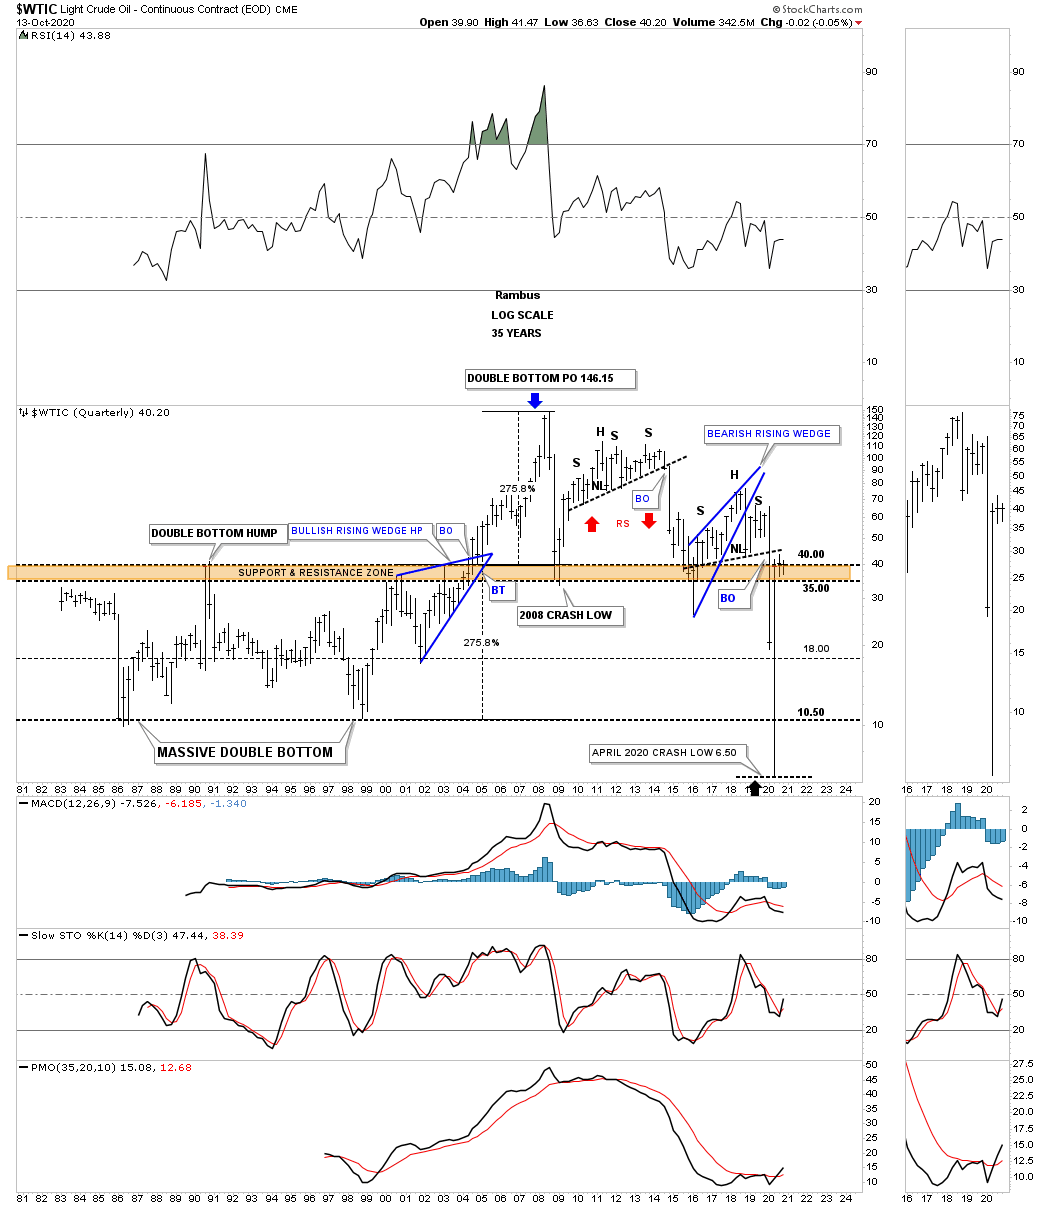
Next is the long term quarterly chart for WTIC that goes all the way back to its inception in the early 1980’s. Just like the CRB index the WTIC also built out a large H&S top which led to its crash in the middle of 2014 to March of 2015. Also like the CRB index we were looking for initial support to come into play at the brown shaded S&R zone which happened. The WTIC also built out the blue bearish rising wedge which then morphed into a classic H&S top with the left shoulder and head forming inside of the rising wedge while the right shoulder high formed on the backtest to the bottom rail of the blue rising wedge.
Note the blue bullish rising wedge that formed in the early 2000’s which gave oil the energy it needed to take out that 20 year brown shaded S&R zone. Also the width of that massive double bottom had a price objective up to the 146 area which ended that parabolic rise which also ended the bull market that began in 1998. I can honestly say that I have never seen a quarterly bar like the April quarterly bar on any chart I’ve ever built. I will be very curious to see what this chart will look like in the next 2 to 5 years.
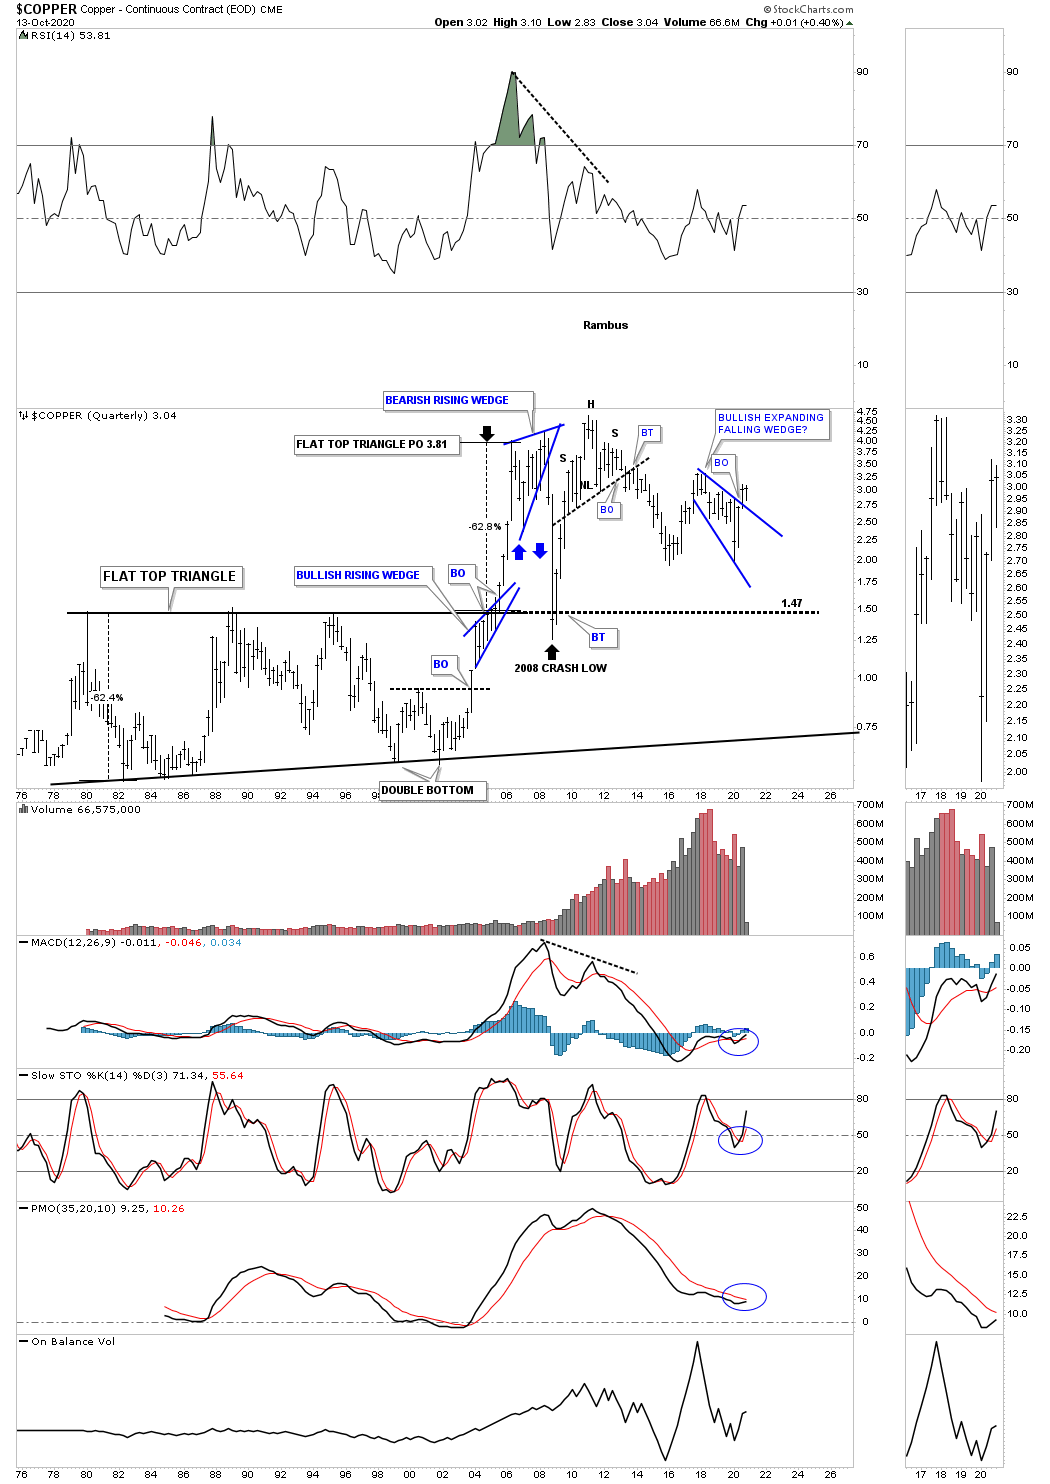
Next is a 45 year quarterly chart for Copper which has held up better than the CRB and WTIC through the years. Just like the CRB and WTIC which built a massive base so to did Copper. The base Copper built began forming in the late 1970’s and finished in 2005 which formed a massive flat top expanding triangle. Copper also formed the blue bullish rising wedge just below the top rail of its massive flat top expanding triangle which gave it the energy it needed to breakout above resistance and rally up to its price objective at 3.81.
Moving over to the right hand side of the chart Copper could very well be building a possible blue bullish expanding falling wedge that was completed last quarter. Copper could also be building a double bottom as well. Also unlike the 2008 crash which backtested the top rail of that massive flat top expanding triangle this latest decline has held up very well failing to make a lower low on this time scale.
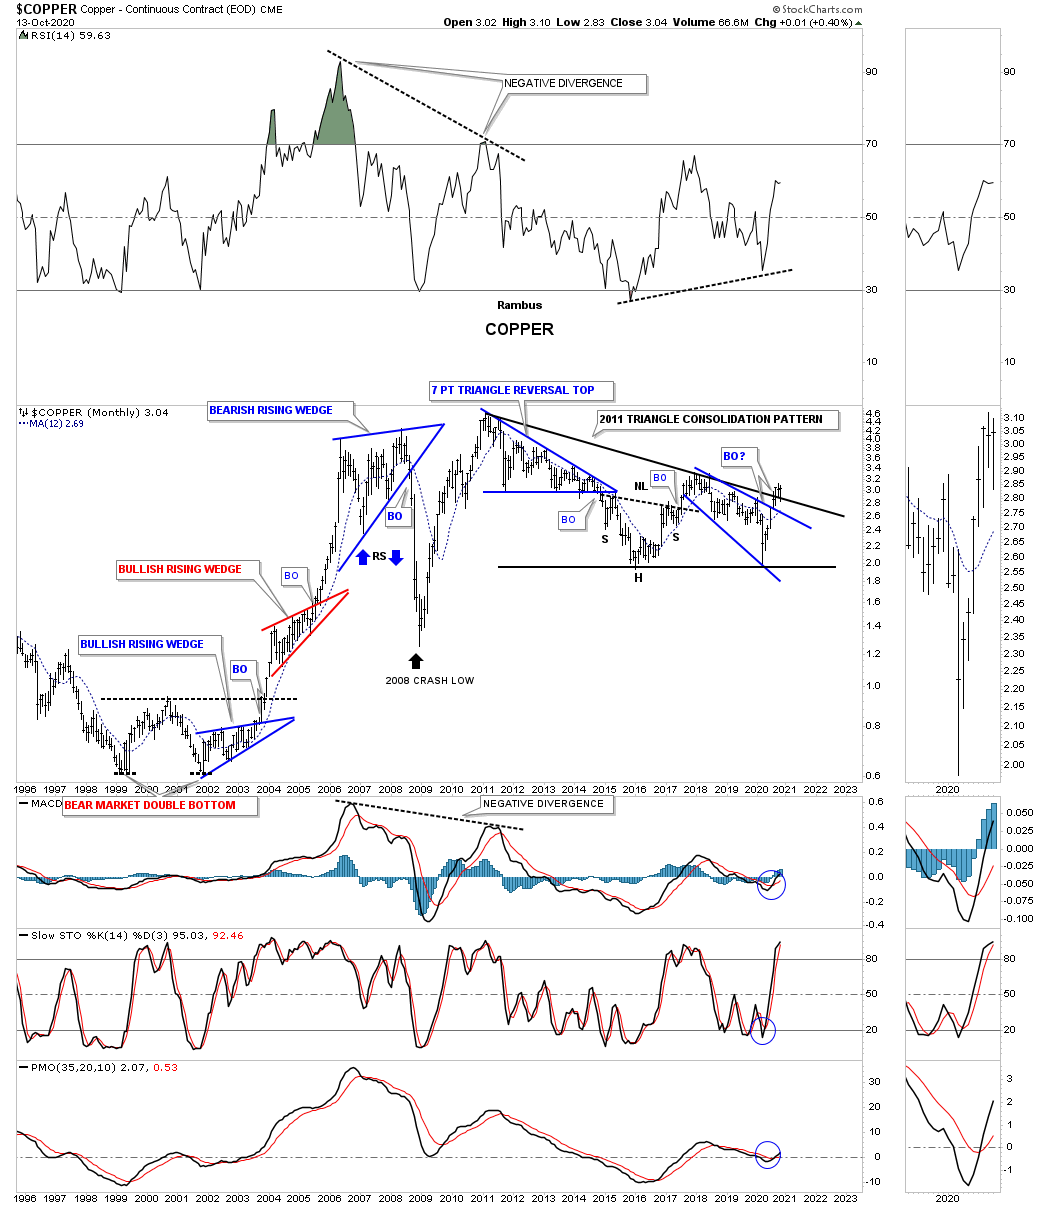
This next chart for Copper is a 25 year monthly chart which gives us another important perspective. Since the 2011 high Copper may very well be building a very large triangle consolidation pattern. The first thing we’ll want to see is for the price action to breakout above the top rail of the small blue expanding falling wedge. If that occurs then the top rail of the 2011 triangle will offer initial resistance which would most likely set up a ping pong move between the two trendlines.
Note the large double bottom which launched Copper on its bull market in 2000 that ended at the 2011 high. If you were to overlay one of the PM stock indexes, say the HUI on top of this Copper chart, these two would match up fairly closely as far as the major turning points are concerned.
The last very long term quarterly chart I built back in 2014 was the NATGAS chart. You can see it has all the similar characteristics that the quarterly charts above are showing. If you stand back a bit and look at this chart from a distance the reverse symmetry on each side of the head is striking IMHO. Just like the other commodities we looked at tonight NATGAS also found initial support on the upper brown shaded S&R zone. The price action is currently trading back up to the previous quarterly high. A move higher will set into motion a higher high which is the first step in an uptrend.

Quarterly Report Commodity Sector Part 3…
In part 3 of this in-depth report on commodities we’ll look at many individual areas to see what their long term charts look like. In order to find long term truning points, bottoms in a bear market or tops in a bull market, the only way that is possible is to look at the big picture. Keep in mind when looking at these long term charts that the process of reversing from a bear market in commodities to a bull market is going to be gradual in the beginning. It will be debated for several years before the realization that inflation is actually taking hold and there will be no more denying the facts. The next debate will be, how high will the inflation rate go? I think the Chartology will keep us one step ahead of the crowd.
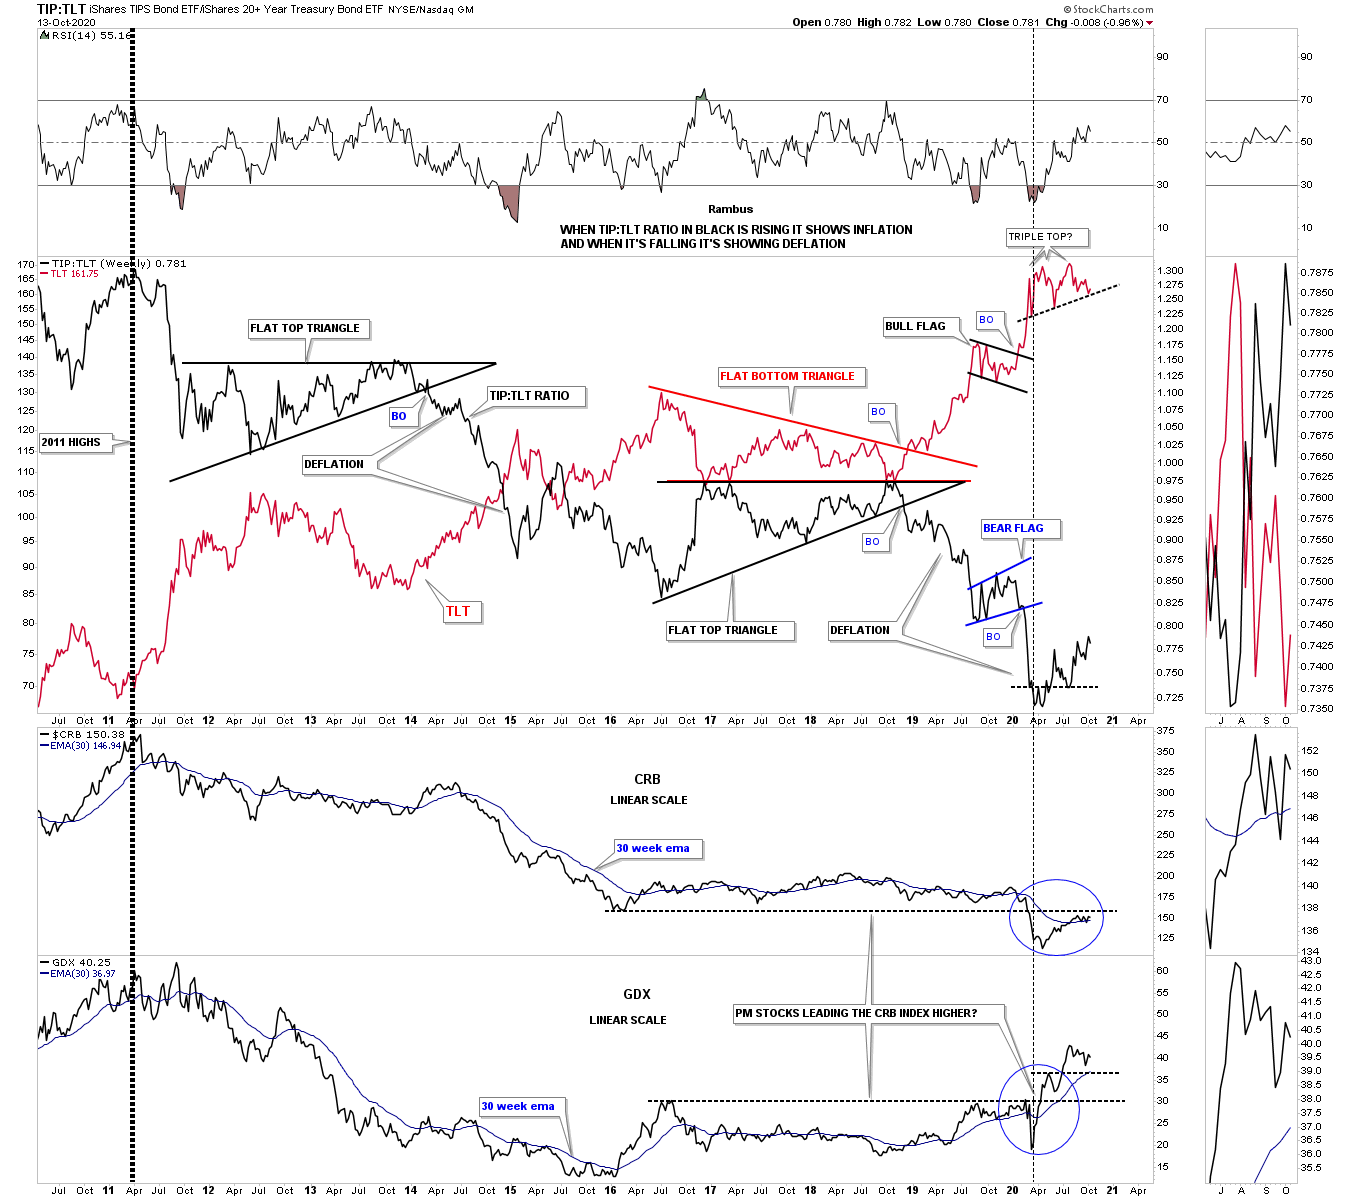
Most investors have their own way to determine whether we are in an inflationary or deflationary environment. For me personally I like to use a ratio combo chart which has the TIP:TLT ratio in black on top overlaid on the TLT in red with the CRB and the GDX below. Below is a long term weekly chart that goes back to the 2011 high when many commodities and the PM complex topped out. As you can see the ratio in black has been in a steady decline for close to 10 years now along with the CRB and the GDX.
Why do I think we are at the very beginning of a possible inflationary environment? The first little clue will be if we see the possible small red triple top complete and breakdown on the TLT which would coincide with the small reversal pattern on the black ratio to begin a strong rally to the upside. Now look to the bottom of this combo chart where the CRB and GDX are located. Note how the CRB, TLT and the TIP:TLT began reversing up 2 months ago in March, black dashed vertical line.
It is generally understood that the precious metals complex usually leads the rest of the commodities higher at important bottoms. Now lets look at the GDX on the very bottom where you can see this happening in real time as it has already broken out above its 2016 overheard horizontal resistance line while the CRB index is still trading below its 2016 resistance line and it 30 week ema. So if the PM complex is leading commodities higher then they should follow the PM complex higher which should eventually lead to some degree of inflation down the road.
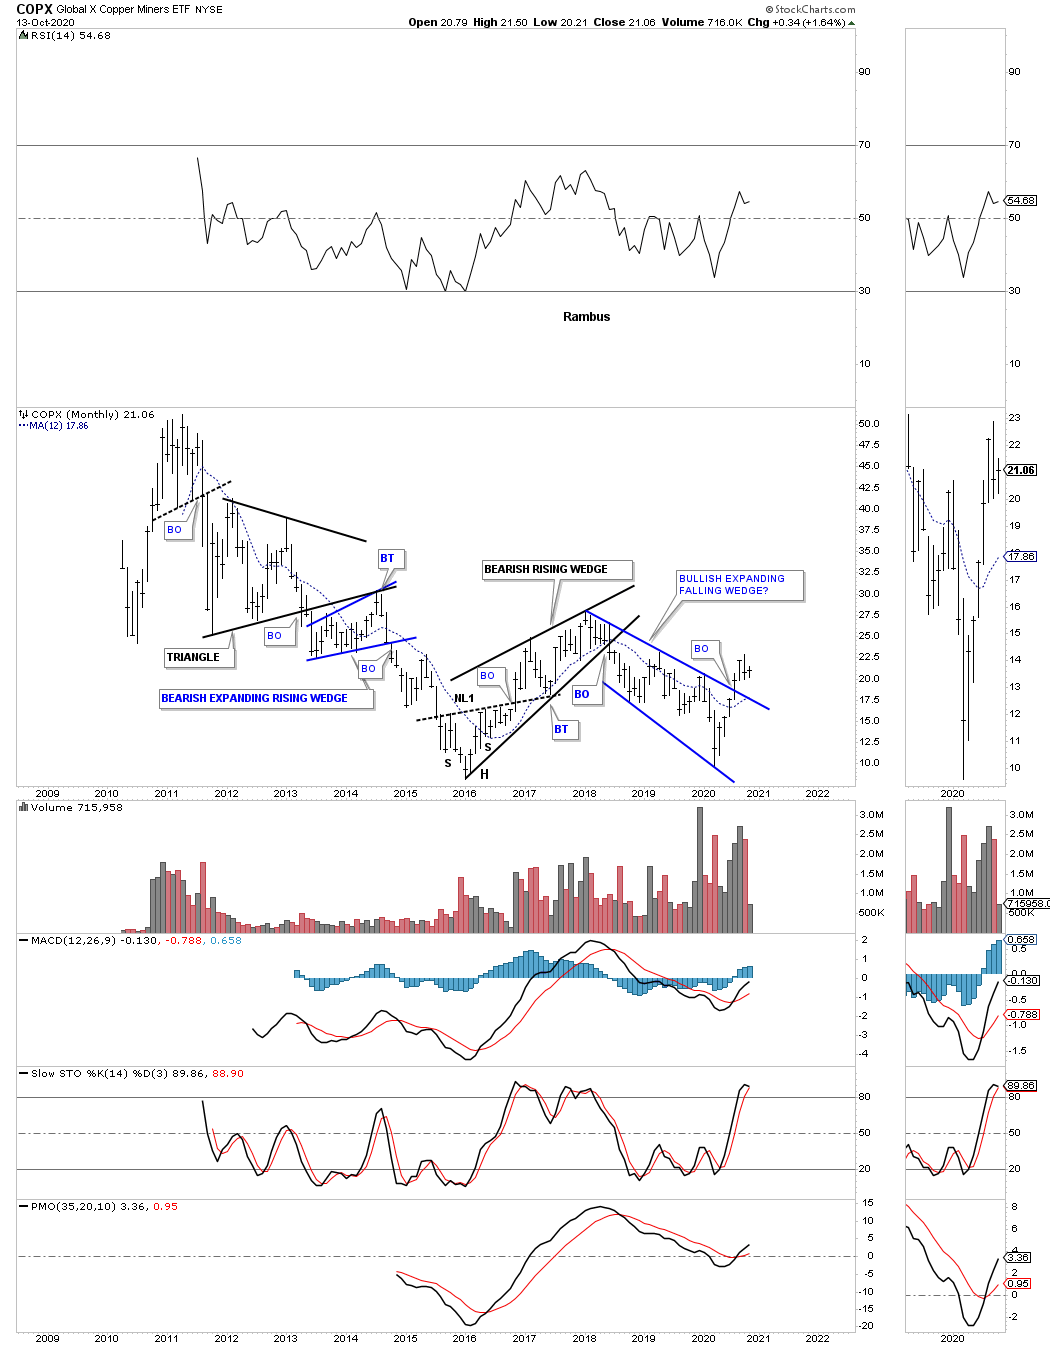
Now lets look at some individual commodities to see what they may be suggesting as far as an important turning point.This long term monthly chart for the COPX, Copper miners etf, has broken out from a bullish expanding falling wedge which could be part of a possible double bottom going back to the low in 2016.
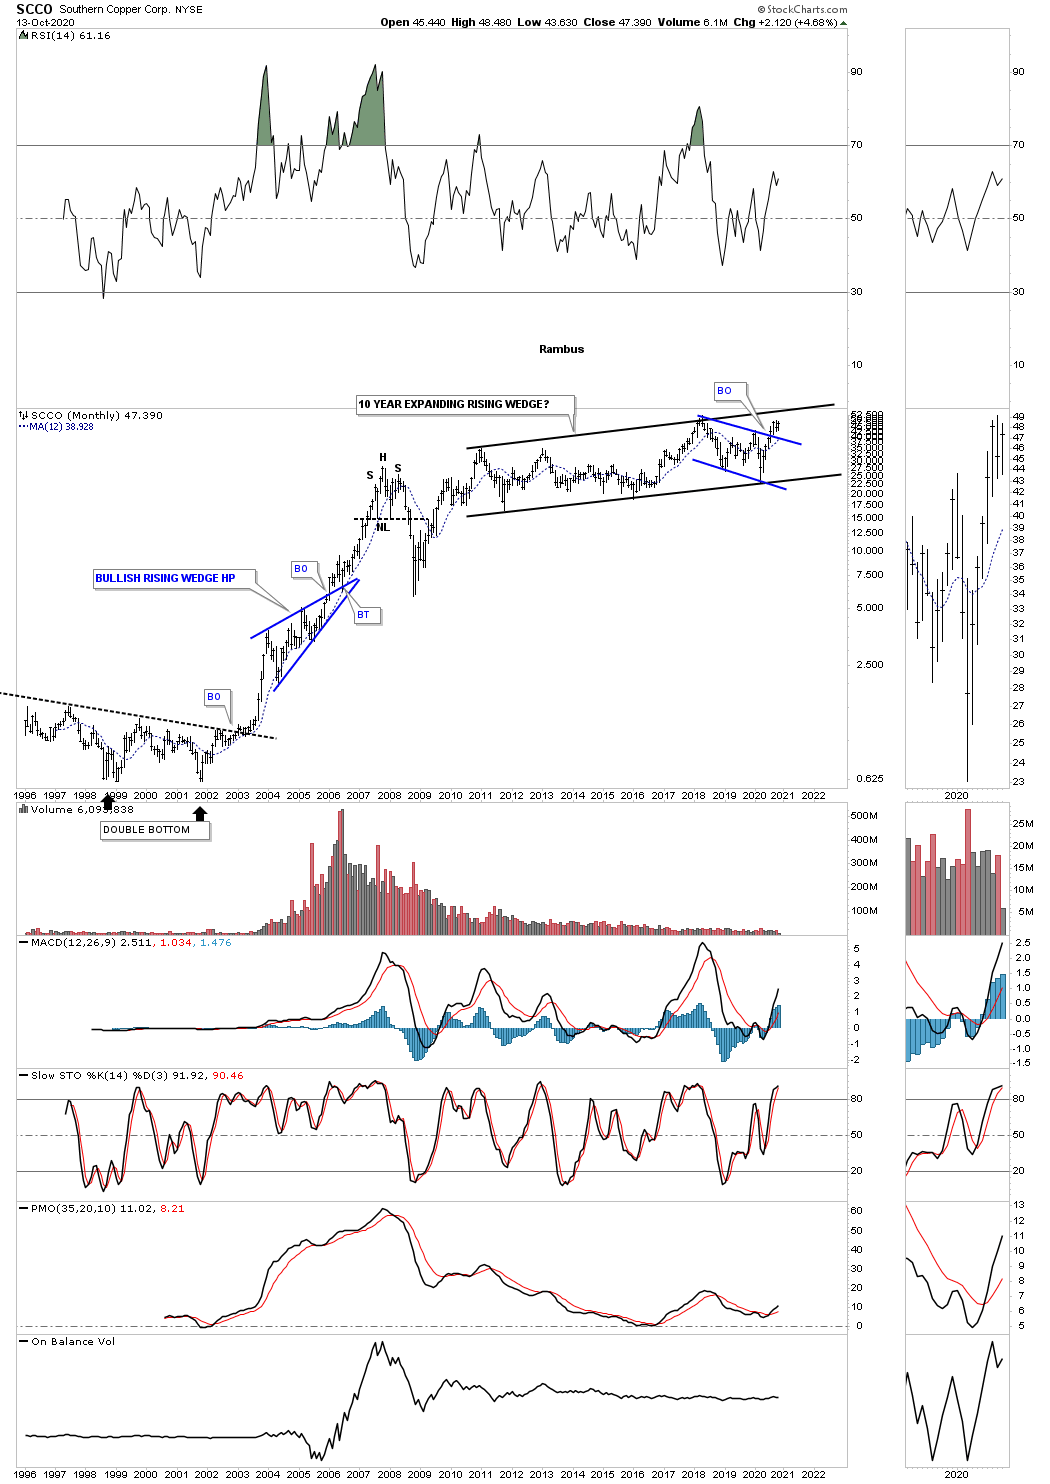
SCCO, Southern Copper, has been building out a 10 year expanding rising wedge. A breakout of the blue flag will ensure a move to the top black rail which could then lead to a major breakout and much higher prices.
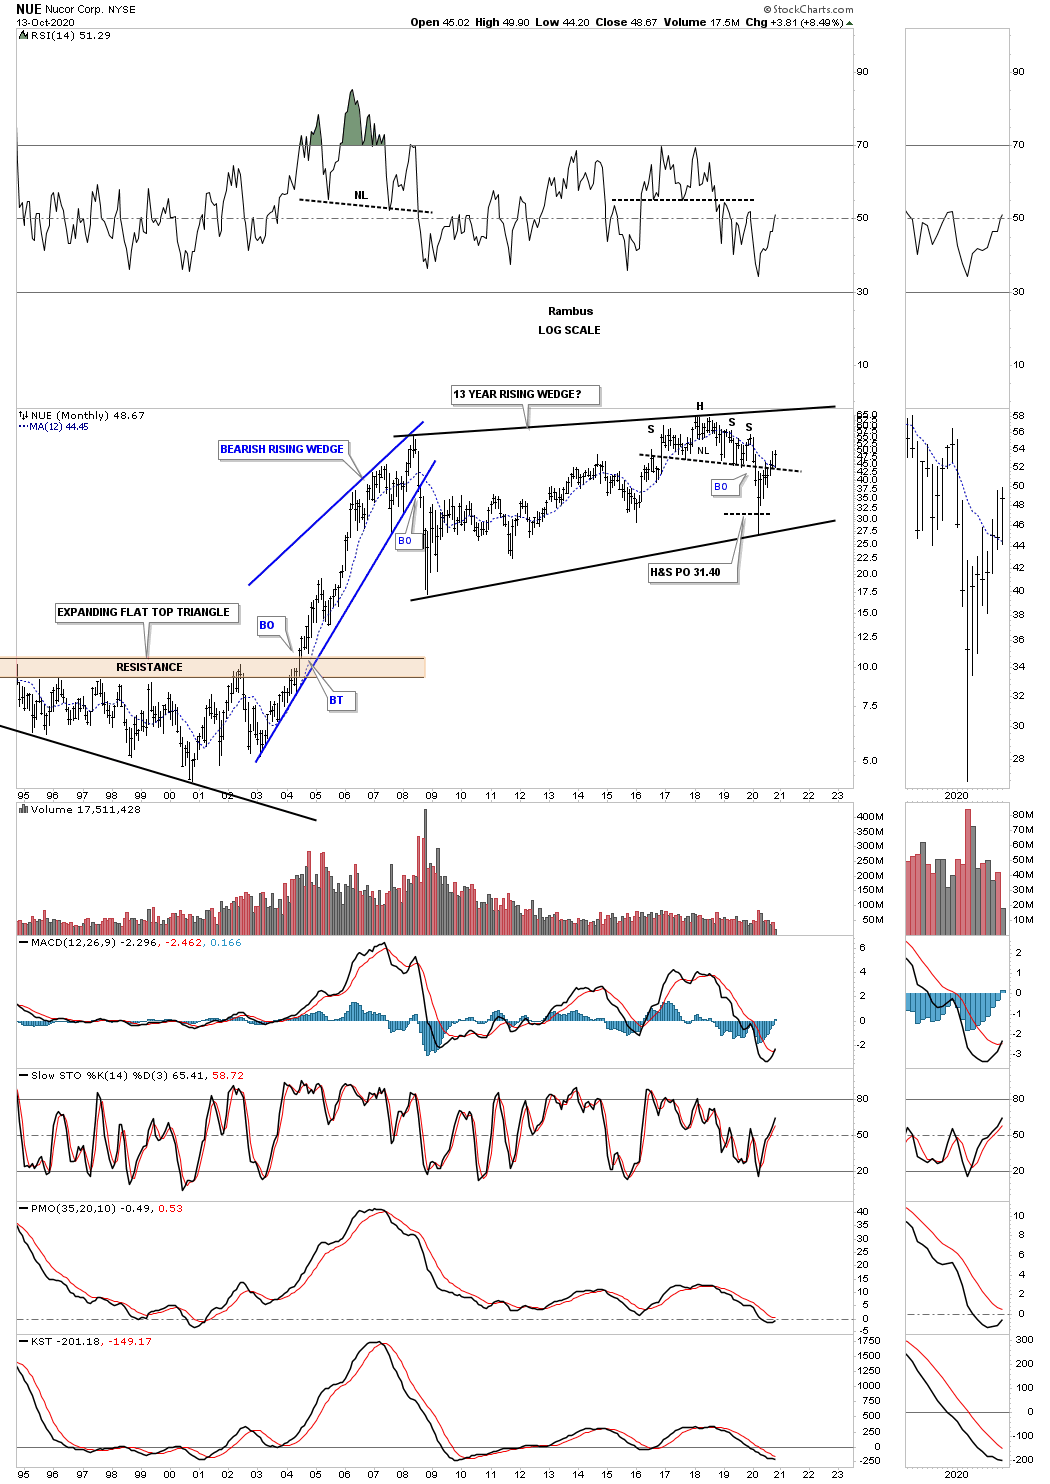
Lets look at a few steel stocks as they have been consolidating for a long time. First is NUE which just finished putting in its 3rd reversal point after breaking down from the H&S top and reaching its measured move at 31.40.
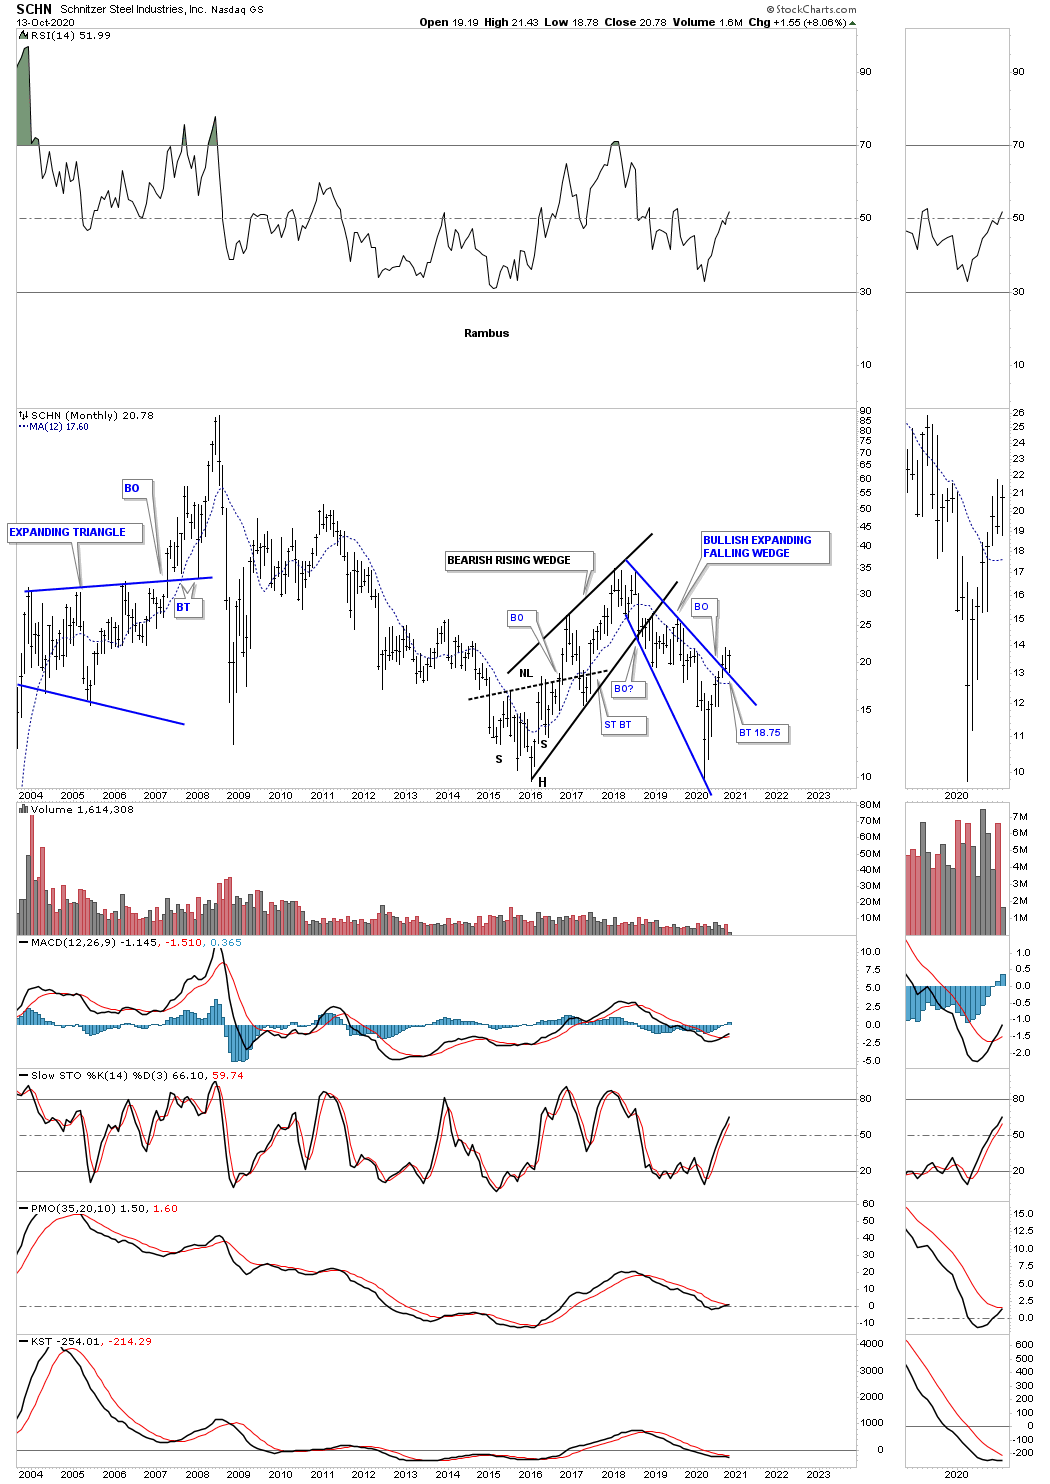
SCHN is another steel stock that is forming a possible bullish expanding falling wedge as the right bottom of a possible double bottom reversal pattern.
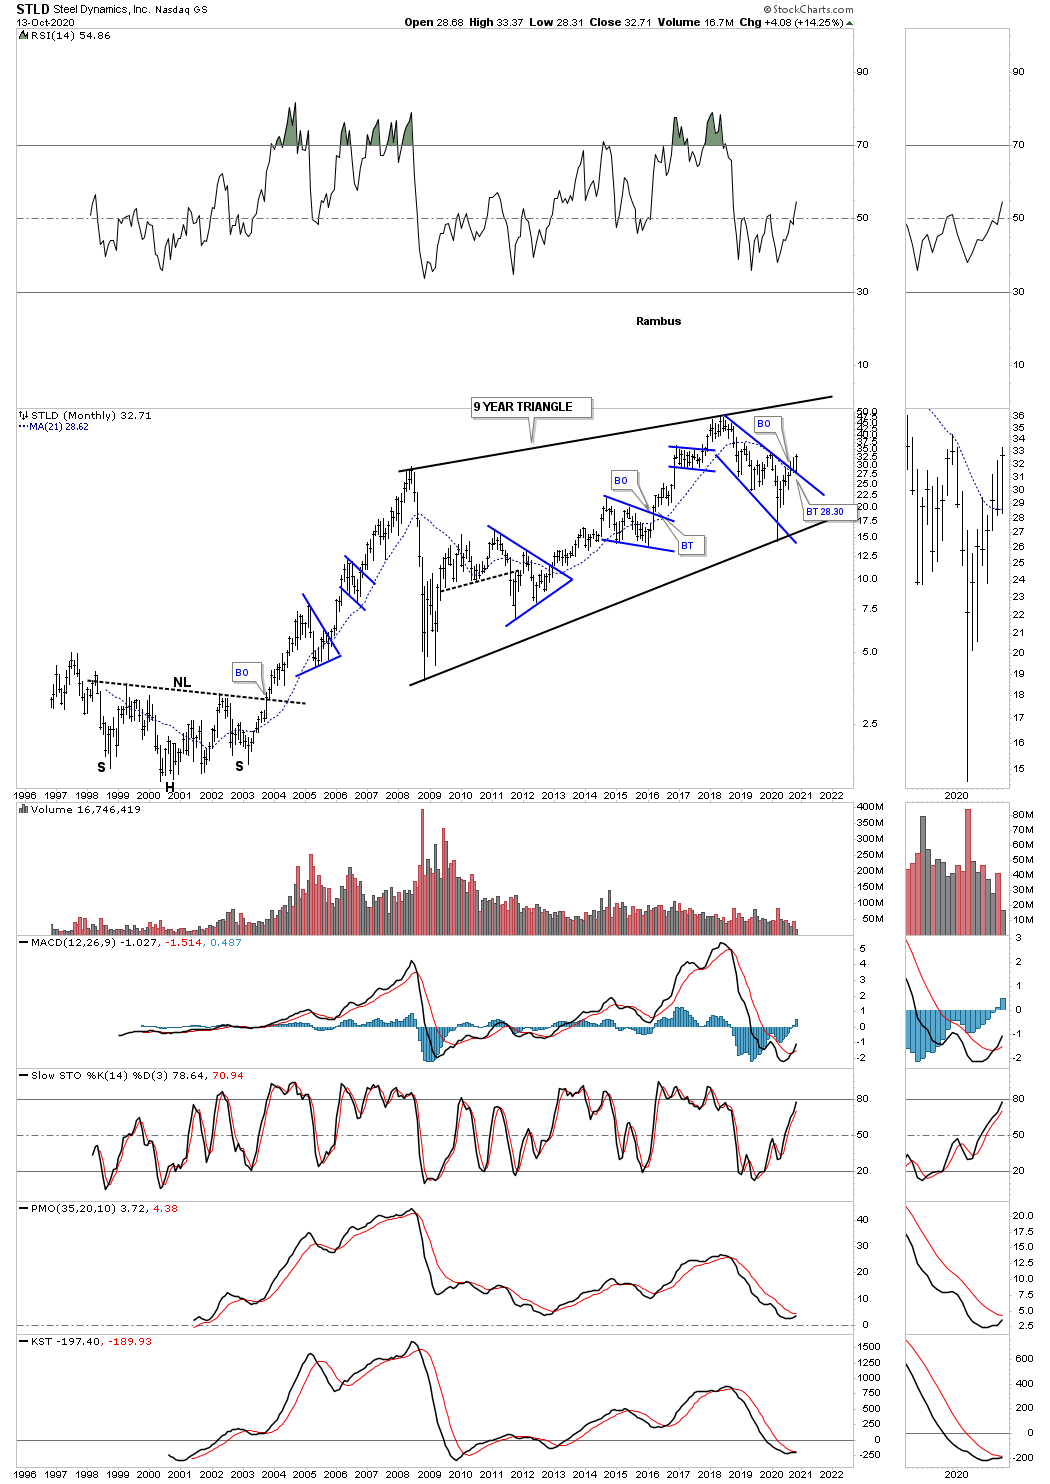
STLD is building out a potential very large bullish rising wedge that is 9 years in the making. The blue consolidation patterns show the internal structure of the 9 year rising wedge with the 3rd reversal point completing during the crash low in March of this year. A breakout of the top rail of the blue expanding falling wedge will be a very bullish development as it will suggest a move to the top rail of the black rising wedge and will complete the all important 4th reversal point.
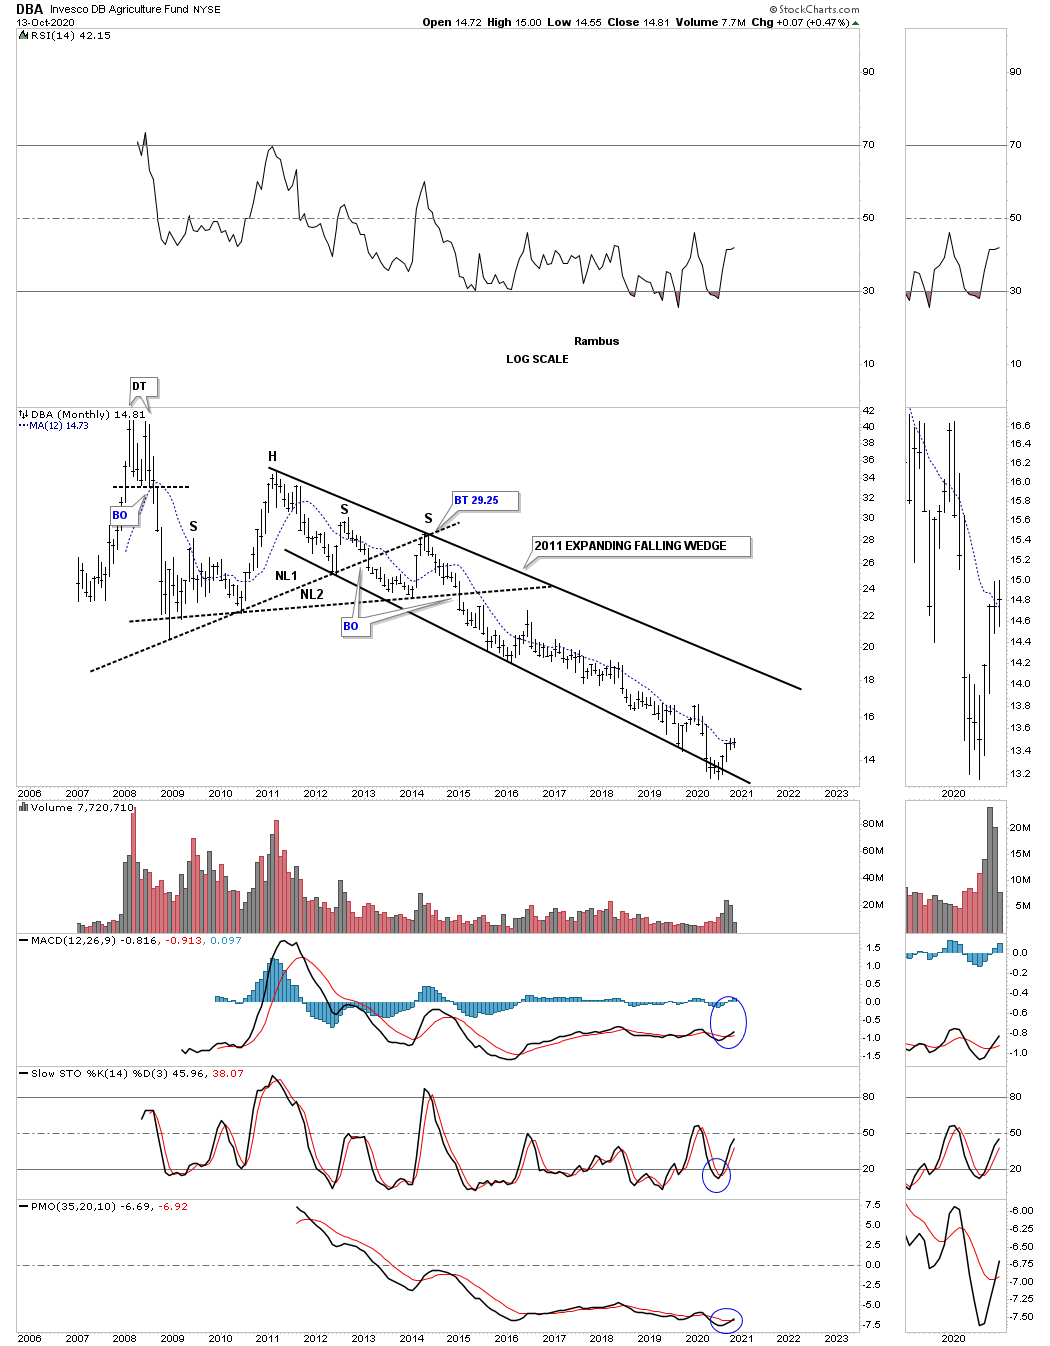
The DBA, agricultural fund, has been trending down since 2011 which puts it right up there with natural gas as the weakest areas in the commodities complex.
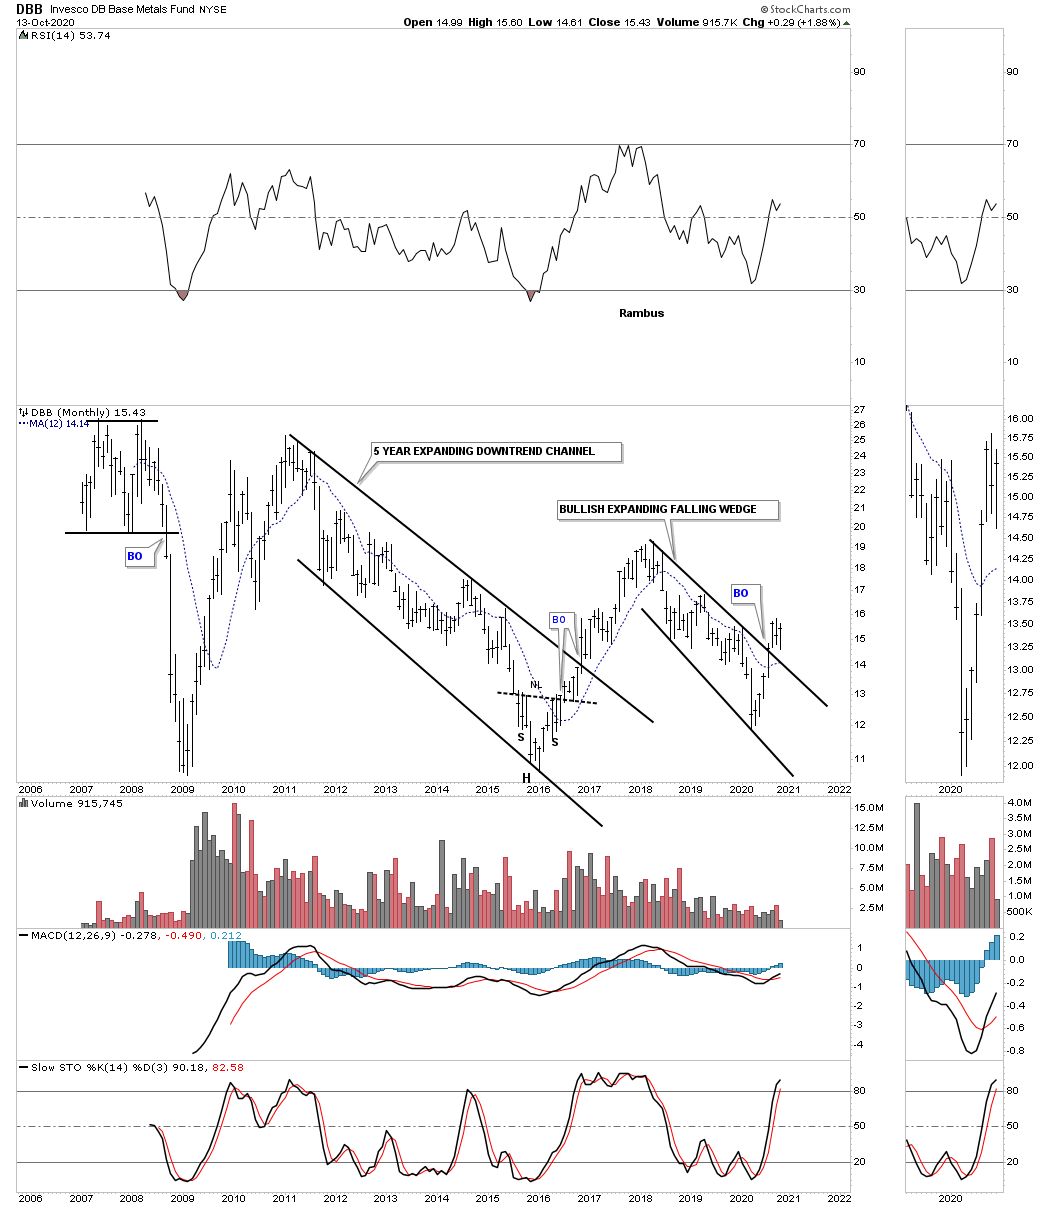
The DBB, base metals fund, has been trending lower since 2018 forming a possible bullish expanding falling wedge.
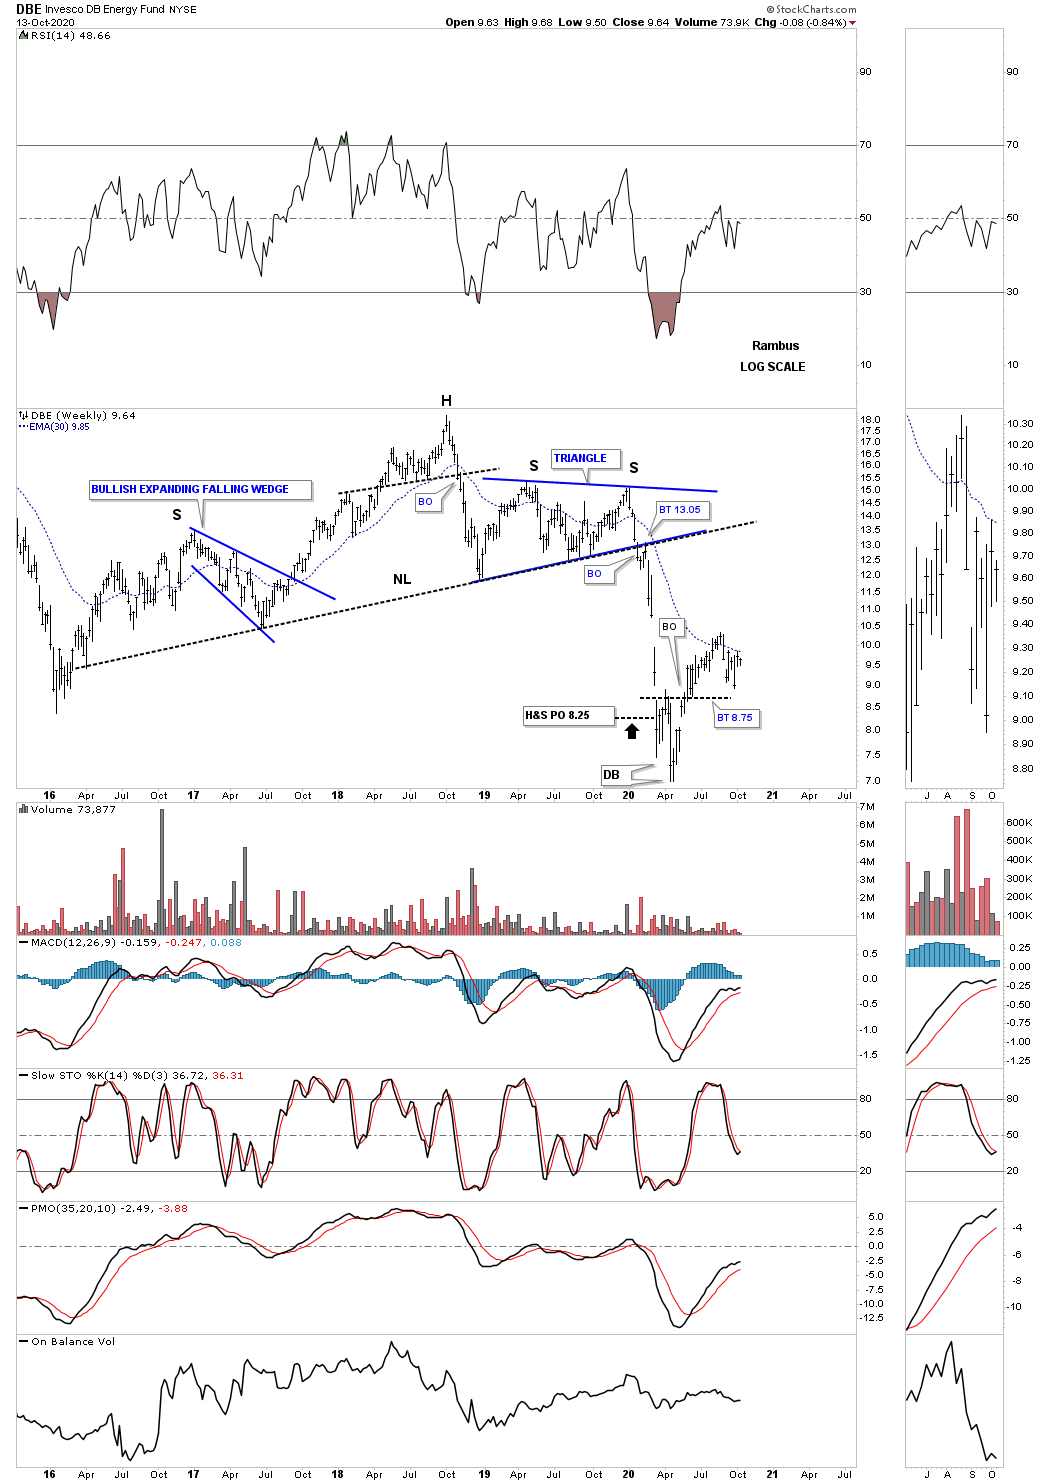
The DBE, energy fund, looks to be completing a small double bottom after reaching its H&S price objective at 8.25.
LIT, Lithium etf, has been in a strong rally after the crash low in March of this year. This area is one of the strongest sectors in the commodity complex as it is making a new all time high.

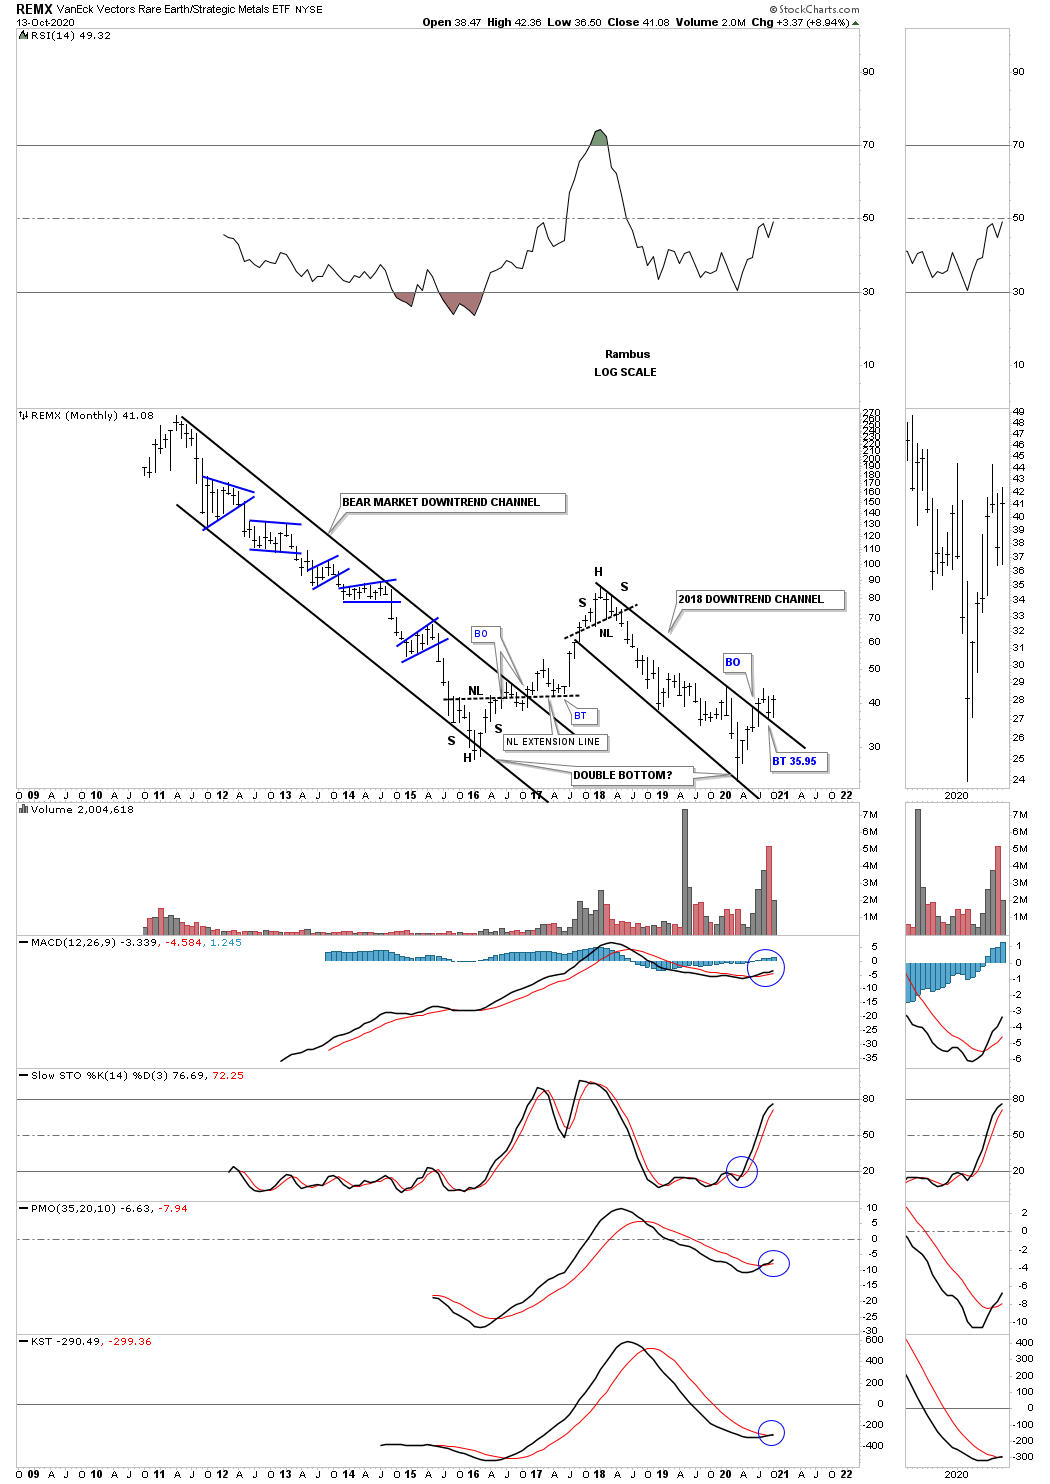
REMX, rare earth etf, has been a dog for most of its existence with only one countertrend rally. The price action has recently broken out from its 2018 downtrend channel with a backtest in place.
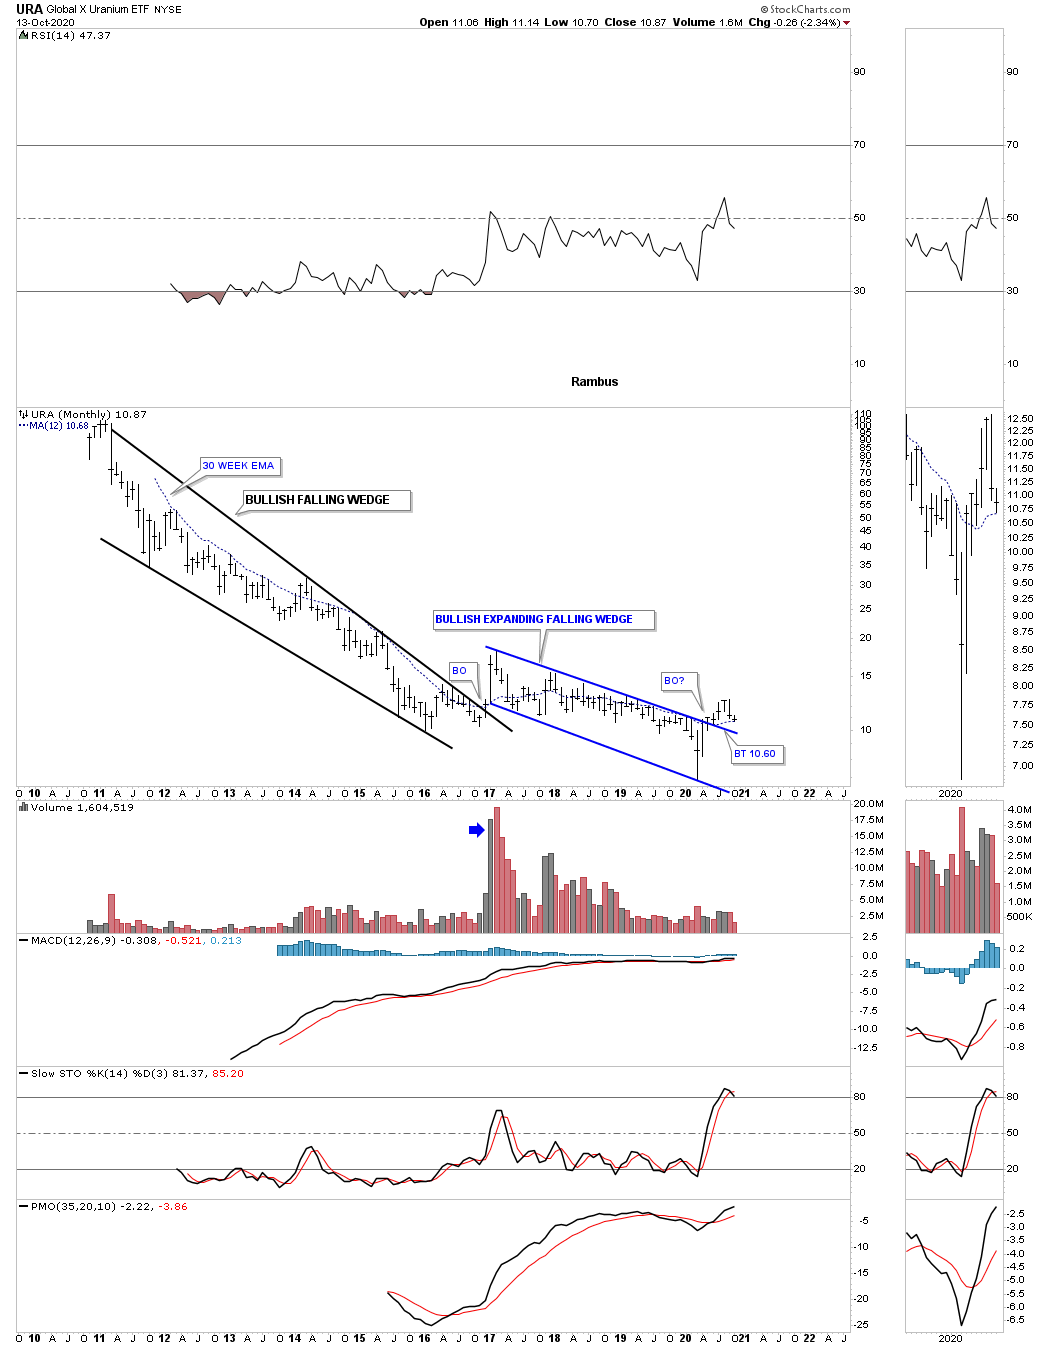
URA, Uranium etf, had been very weak for most of its existence but could be showing a little life if it can hold the potential breakout above the expanding falling wedge on the backtest that is currently underway.
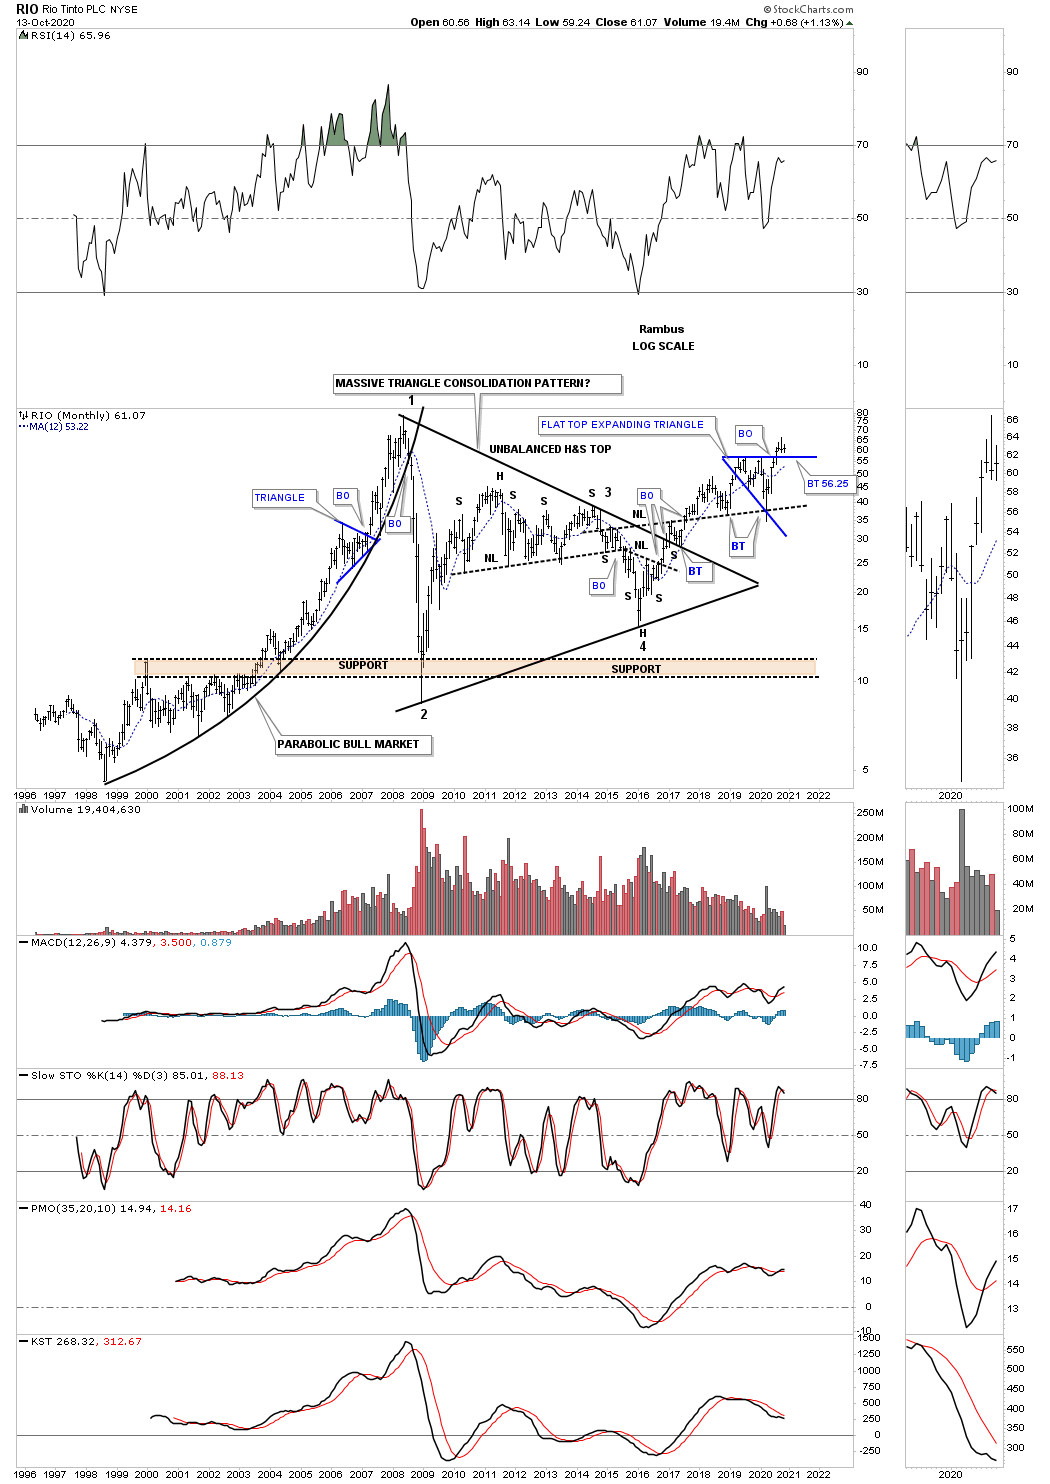
RIO is a very large mining company which formed a massive 10 year triangle with the breakout taking place in December of 216 and has been in a bull market ever since. It found support for the 2nd time on the backtest to the neckline symmetry line taken from the 2016 H&S bottom. The price action is now trading in its 3rd month above the flat top expanding triangle.
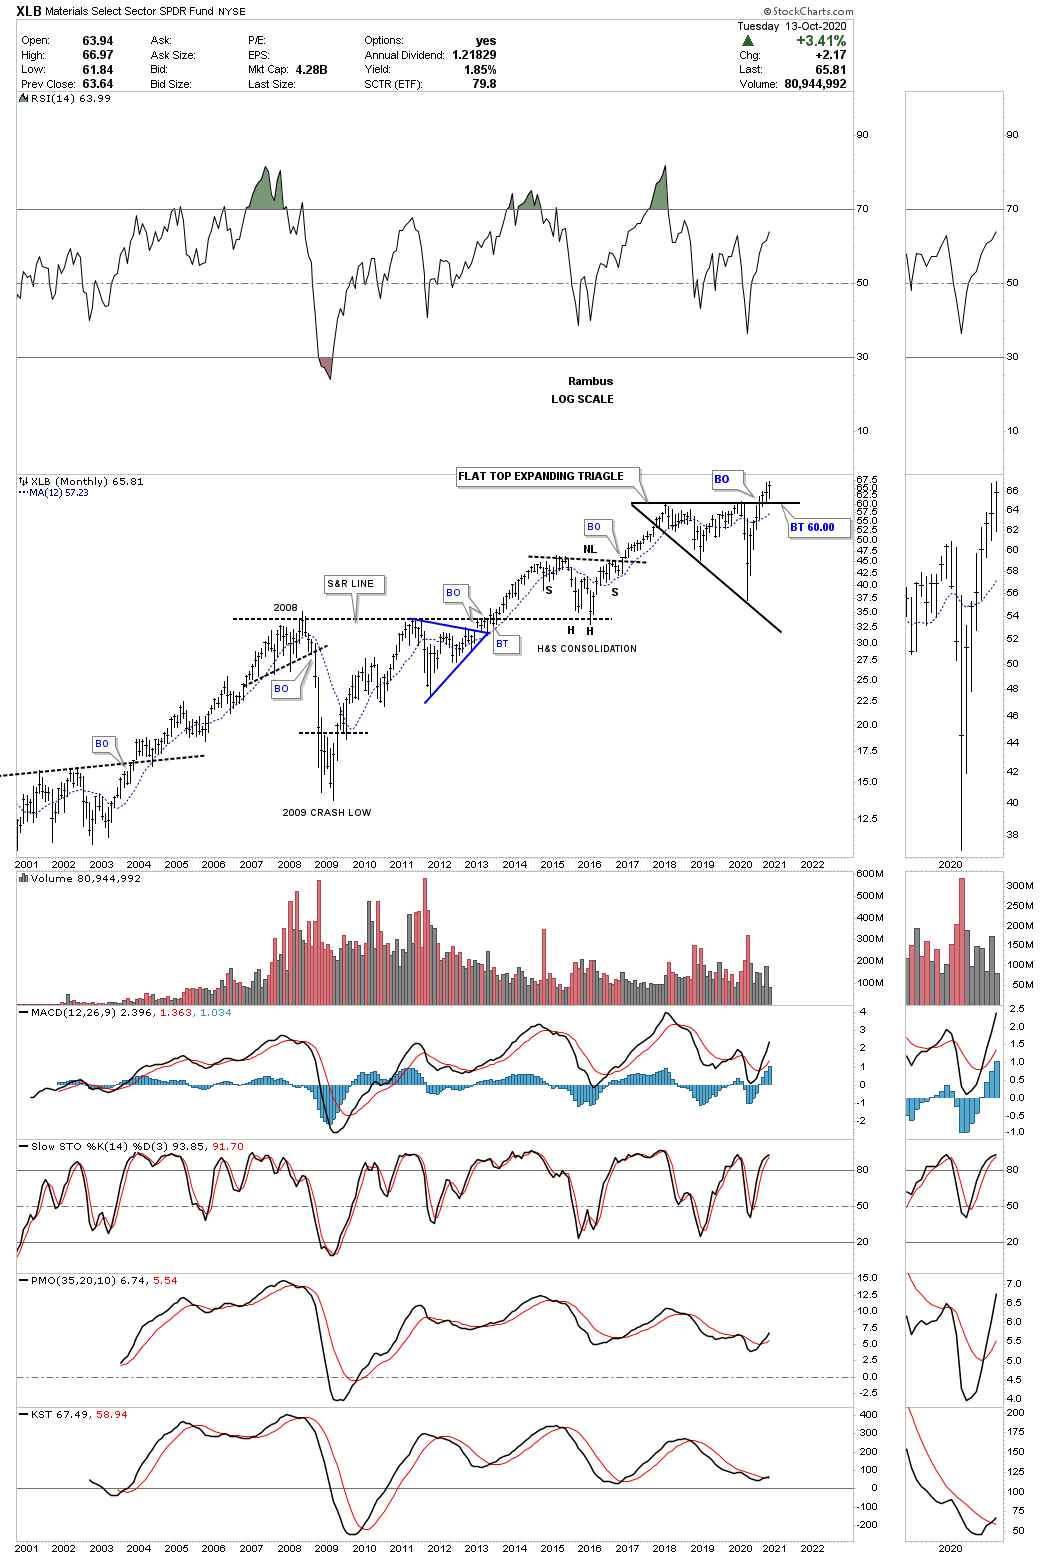
The XLB, basic materials fund, sold off hard during the March crash but has rallied back up to close at new all time highs. Like several stocks we’ve looked at today the XLB has also formed a flat top expanding triangle which could be a very bullish pattern if we get the breakout above the top rail that will coincide with the other flat top expanding triangles we looked at. There are a lot of stocks in the XLB that are also in the INDU so these 2 can move somewhat together.
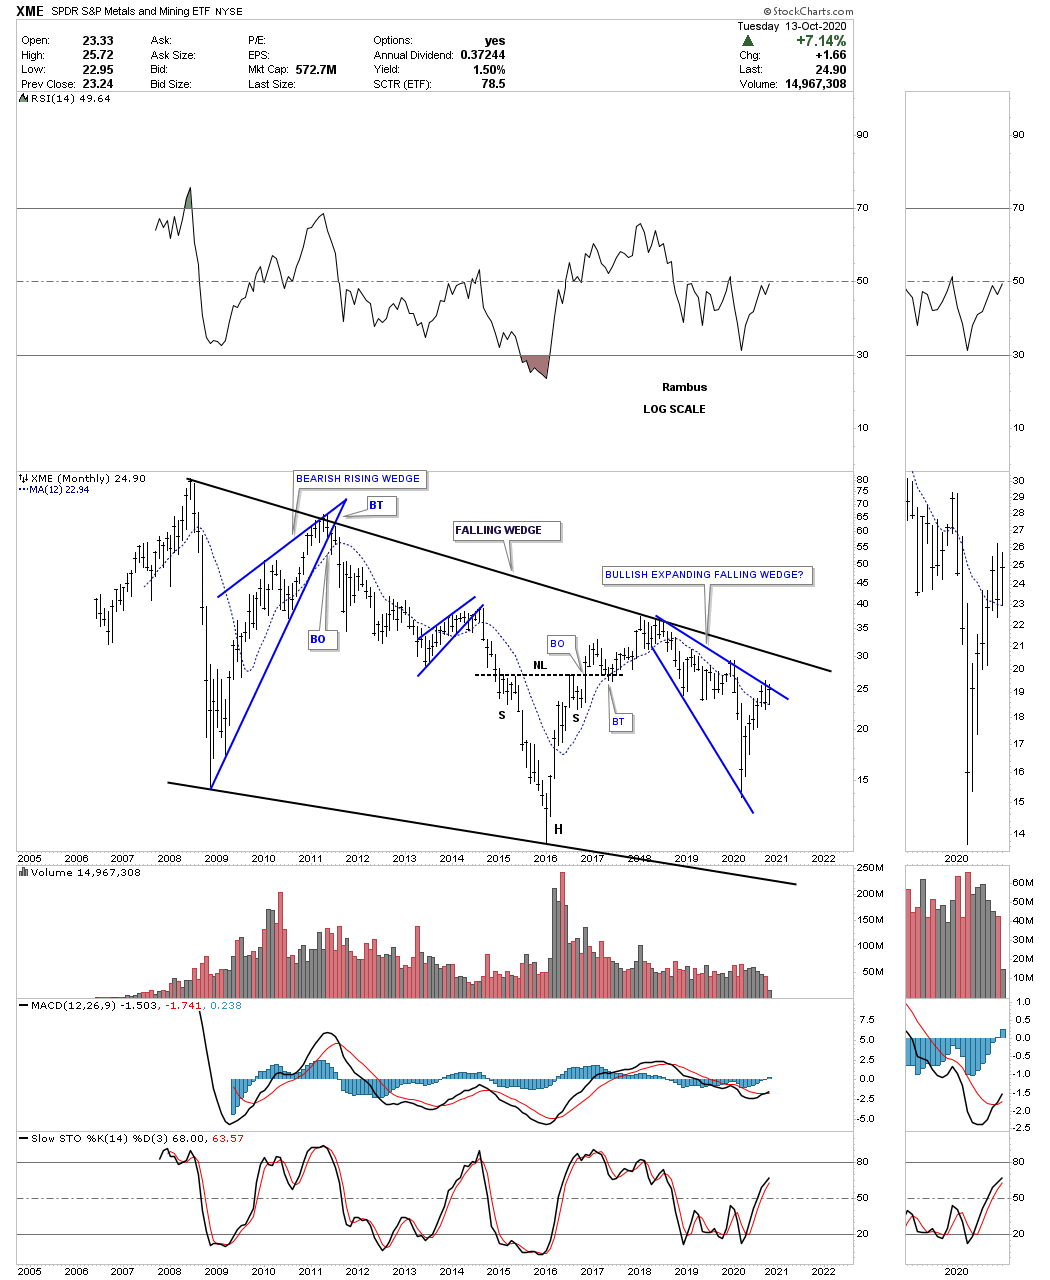
This last chart for this commodities report is the XME, metals and mining fund. This monthly chart shows the entire history of the XME and how it has traded in the confines of the falling wedge. It to is building out a possible bullish expanding falling wedge like many other stocks we’ve looked at today. You may also recall there were many bullish expanding falling wedges that were made on many of the PM stocks as well.
If we are seeing the actual bottom in the commodities complex there will not be a bell that rings to let everybody know. The environment at an important low is generally pretty muted with most investors not even remotely aware of what is taking place as their main focus is in other areas. When we put all three parts together for this commodity report I think they paint a very clear picture that if all the pieces come together over the next month or so we will have a heads up on most investors. All the best…Rambus
Quarterly Report Stock Markets…
In this last post for the Quarterly Report I would like to update some very long term charts for some of the US stock markets and other areas to see how this secular bull market has been progressing since the 2009 crash low. It is easy to forget the secular bull market when you see a black swan or an act of God event that totally changes the dynamics on the shorter term time scale. It is these long term charts which keeps one focused when all hope appears to be lost.
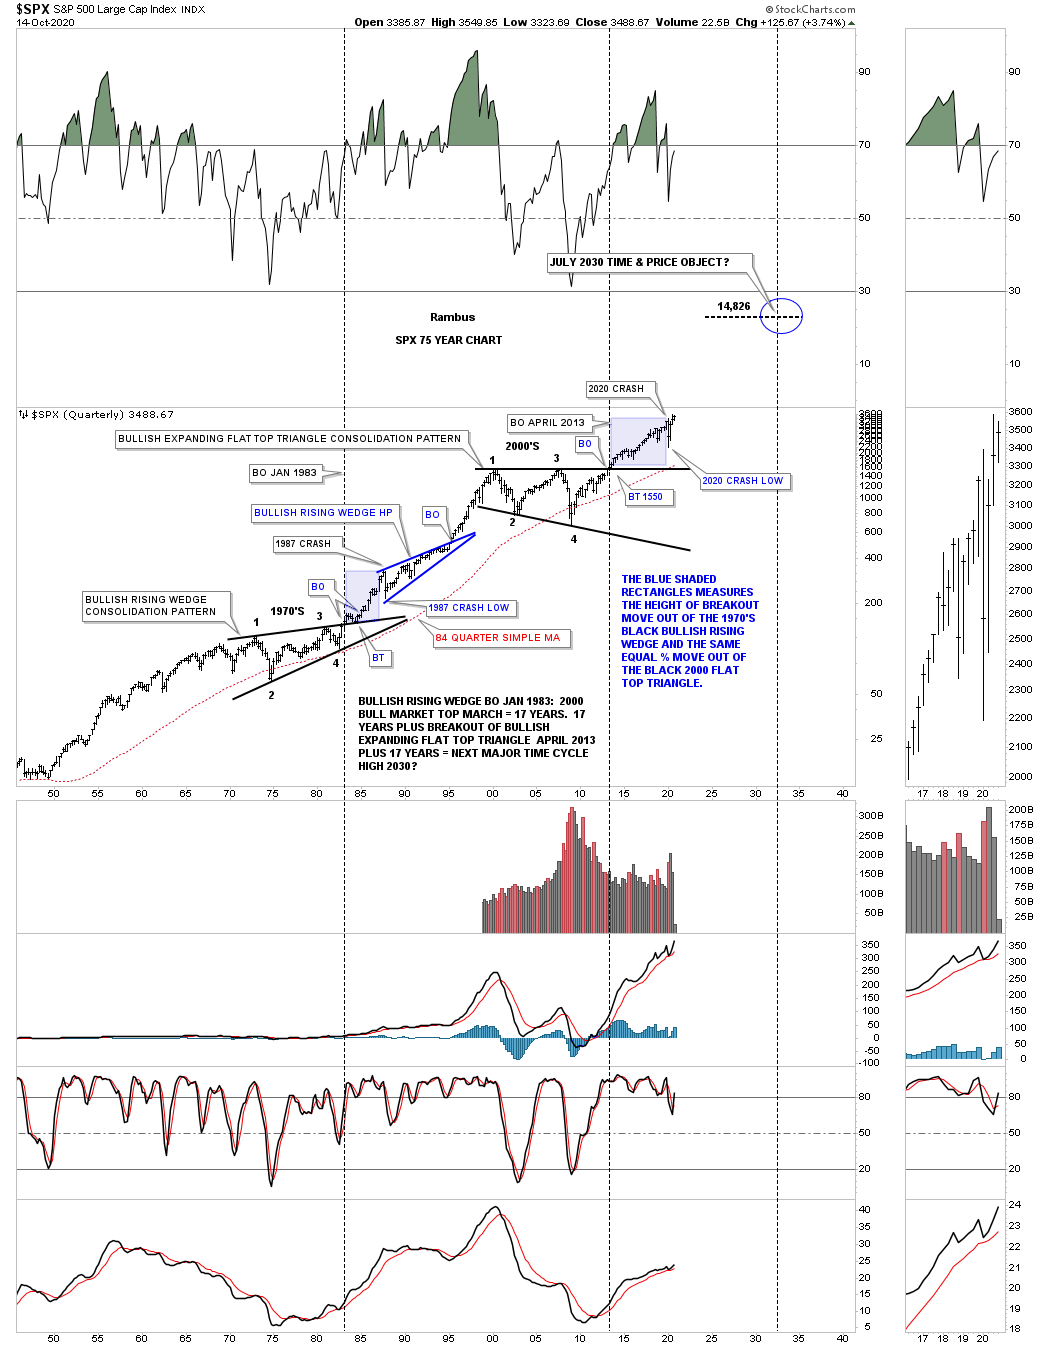
So what does a secular bull market look like? Below is a 75 year quarterly chart for the SPX we’ve been following since the breakout from its massive flat top triangle consolidation pattern in 2013 when just about every other US index and world stock markets broke out of their respective massive consolidation patterns. This big picture look shows no signs of ending anytime soon. We just experienced one of the biggest crashes in the history of the stock market and still the SPX is trading not to far off of its all time highs.
For those that haven’t seen this chart before you can see the last massive consolidation pattern, the bullish rising wedge, which formed as a resting area for the previous secular bull market. Note the blue shaded areas that formed during the 1987 crash and the current one that shows the 2020 crash. The blue shaded areas measures the height only and not time. The initial rally out of the 1970’s bullish rising wedge to the top in 1987, just before the crash, is almost identical to the height of of the 2020 high before our recent crash that many believe we are still in. If we are truly in a secular bull market, which is where my money is, we won’t see the 2020 crash low ever again.
The breakout from the 1970’s black bullish rising wedge took place in January of 1983 and ran until the top in 2000 which took 17 years. The breakout from the 2000’s flat top expanding triangle took place almost 30 years later and shows no sign of failing. If our current secular bull market as measured from the April 2013 breakout point should last at least 17 years that would put the time component to around the 2030 area. For now that is a rough estimate which we can fine tune as time goes on. Note how the red 84 quarterly moving average was only breached 2 times in the last 70 years, once during the formation of the 1970 massive bullish rising wedge and the 2nd time during the formation of the 2000’s flat top expanding triangle.
As long as a scenario is working there is no need to change anything. Since the breakout from the 2000’s flat top expanding triangle in 2013 nothing has changed in order for me to reconsider the possible long term scenario. Even the 2020 crash which was one of the strongest and quickest correction in the history of the stock markets wasn’t able to change the big picture in any meaningful way.
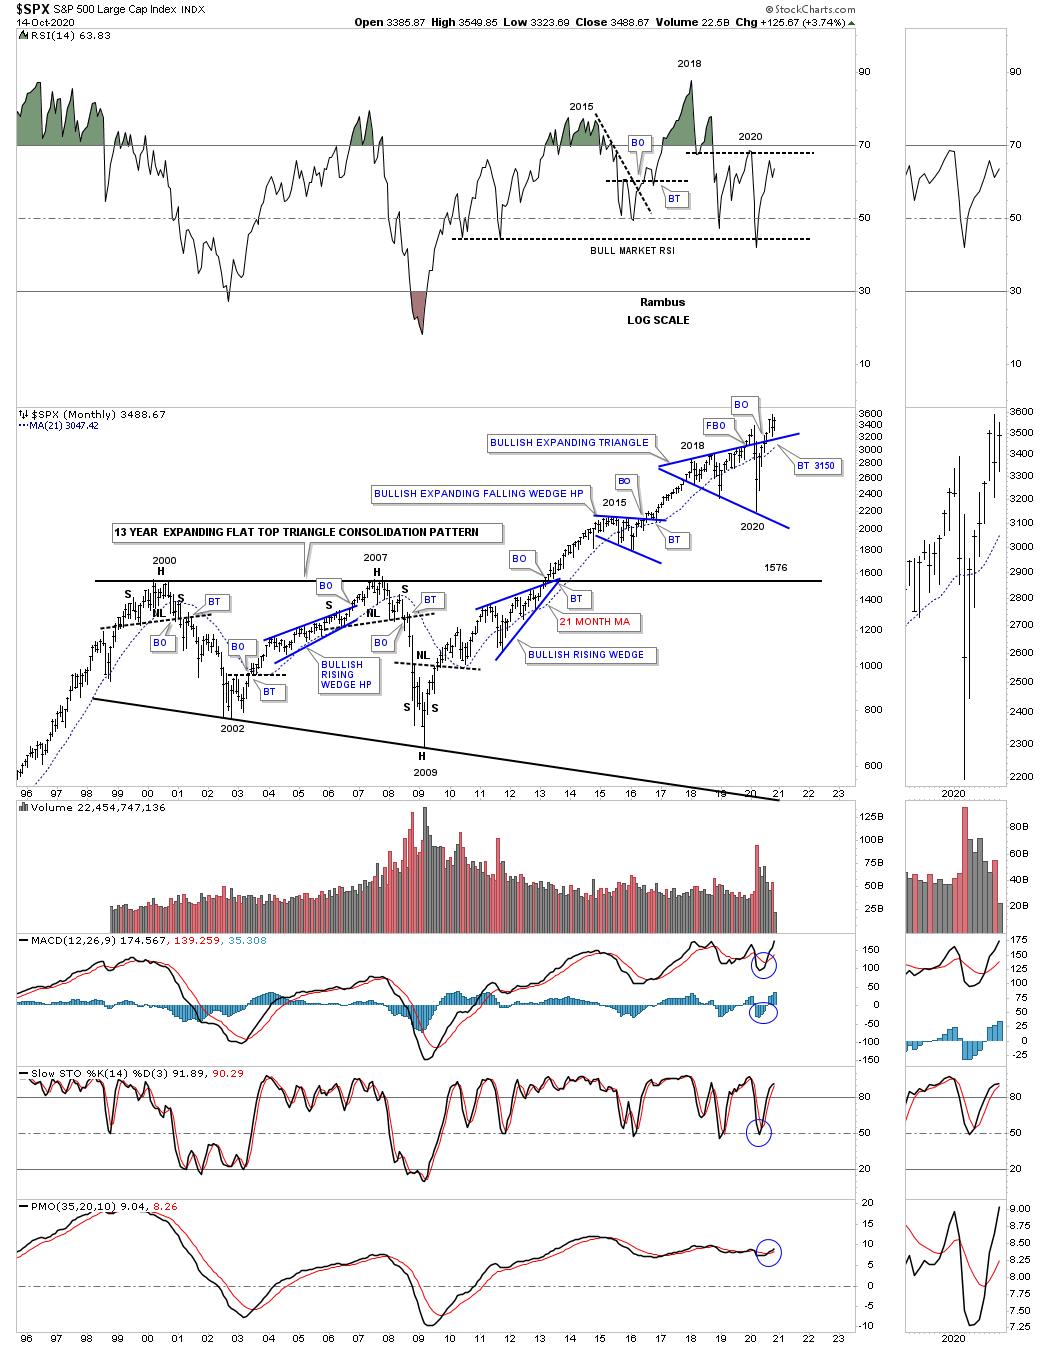
This next chart is a 25 year monthly chart for the SPX which shows the internal structure of that 2000’s flat top expanding triangle along with the 21 month ema. I often show how big consolidation patterns can be made up of smaller reversal patterns at the reversal points. This chart shows you a classic example of how it looks. Another piece of Chartology I often discuss is that many times when a stock reaches an important resistance line it will form a small consolation just below it to build up the energy it needs to finally take out that overhead resistance line. Here you can see the blue bullish rising wedge that formed just below the top rail which led to the breakout into new all time highs back in 2013. The next thing I’ll be looking for is for the SPX to make a new all time high which will be confirmation that the next impulse move is continuing after the backtest was completed.
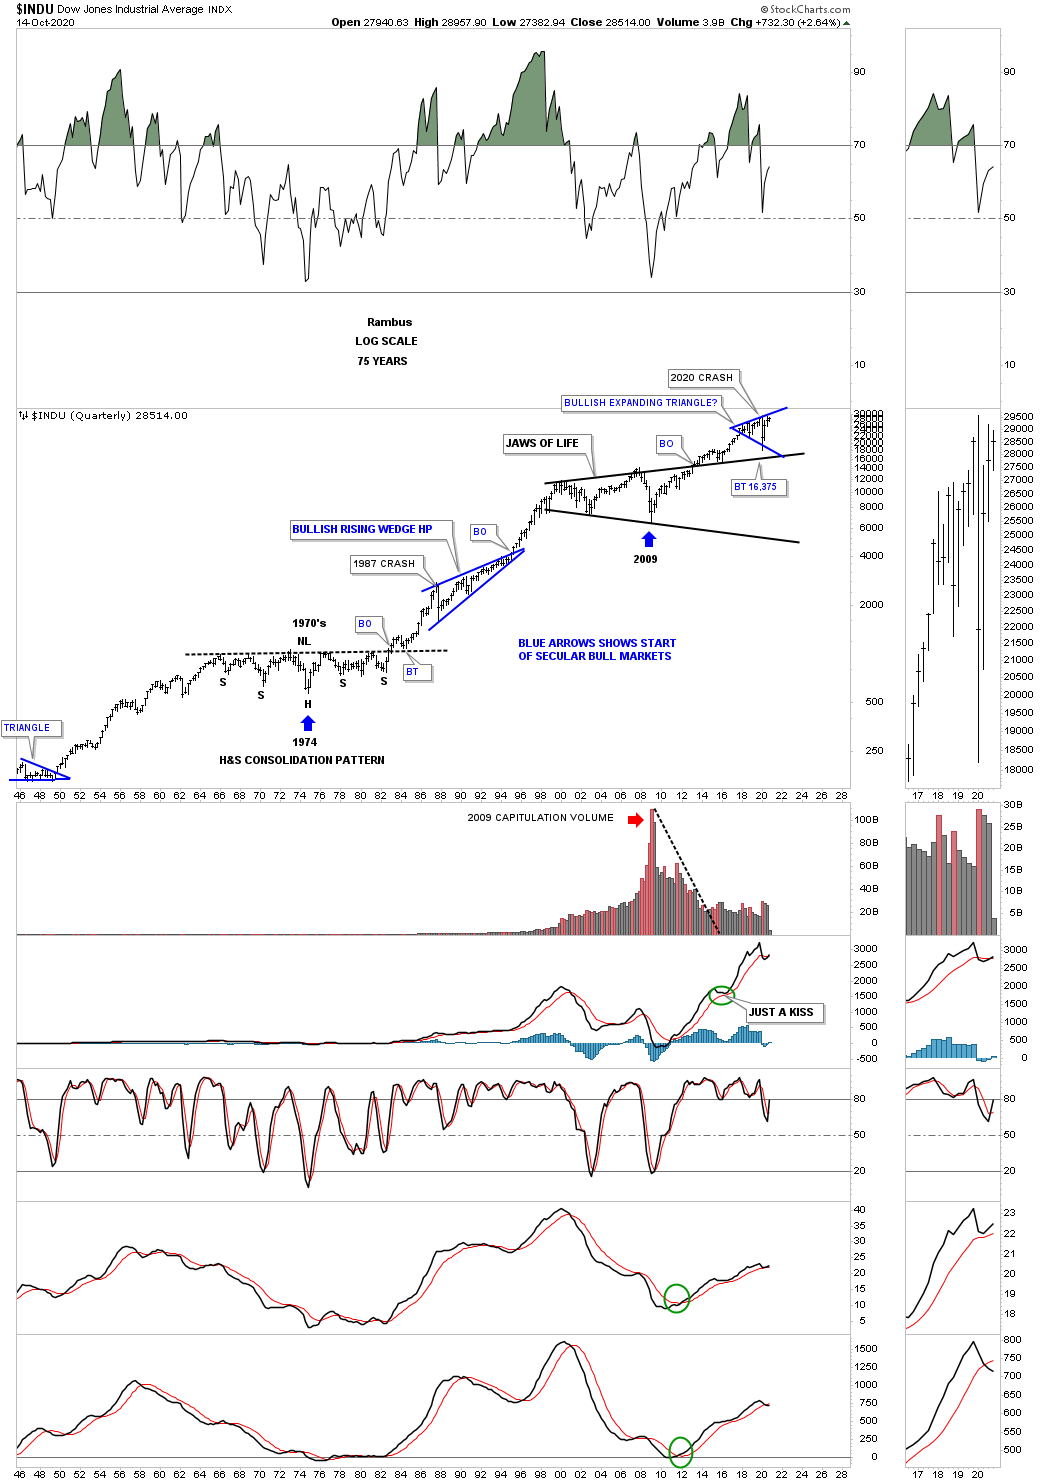
Next is the 75 year quarterly chart for the INDU which shows its secular bull markets. Back in the late 1960’s and 1970’s the INDU built out a beautiful and symmetrical H&S consolation pattern which launched the secular bull market that came to an end in 2000. You can even see the perfect backtest to the neckline after the breakout. After that nearly 25 year secular bull market that ended at the 2000 high it was time for the INDU to consolidate all those massive gains which formed the Jaws of Life. Note how close the price action came to touching the top rail of the Jaws of Life consolidation pattern during the 2020 crash. A breakout above the top rail of the blue expanding triangle will usher in the next important move higher in the secular bull market that began at the 2009 crash low.
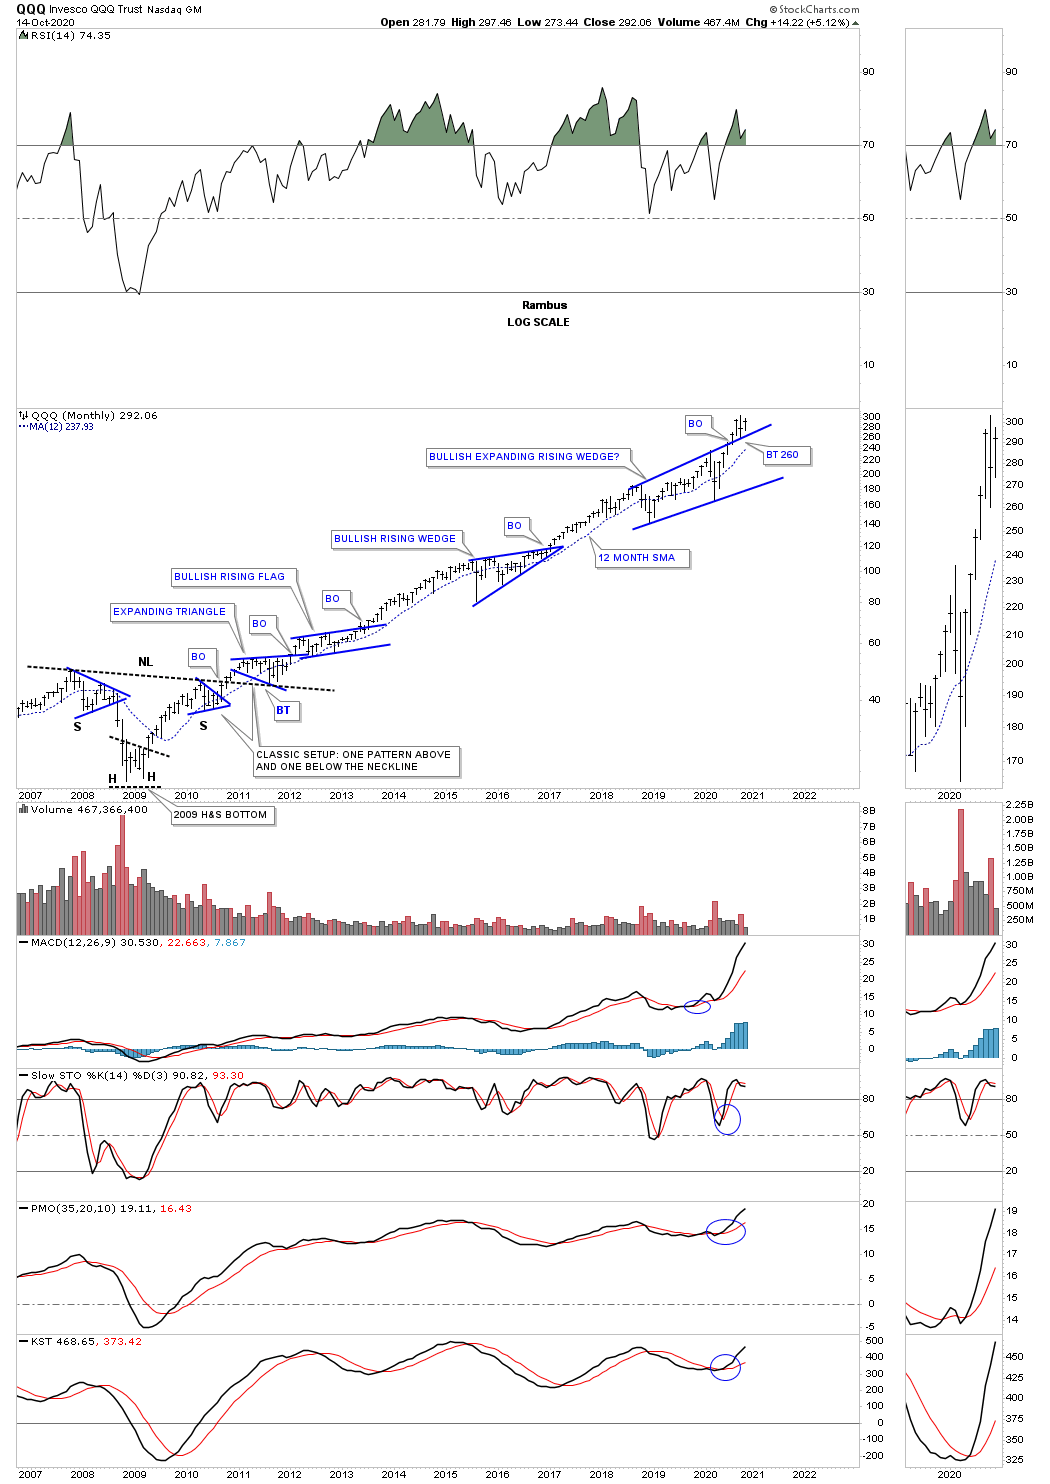
The QQQ’s secular bull market began with a very symmetrical H&S bottom at its 2009 crash low. We’ve discussed in the past that when you see one consolidation pattern form below the neckline, right shoulder, and then one just above the neckline that is a very bullish setup. What I find interesting right now is that QQQ broke out from the bullish expanding rising wedge 4 months ago and this is the biggest consolation pattern of the entire secular bull market.
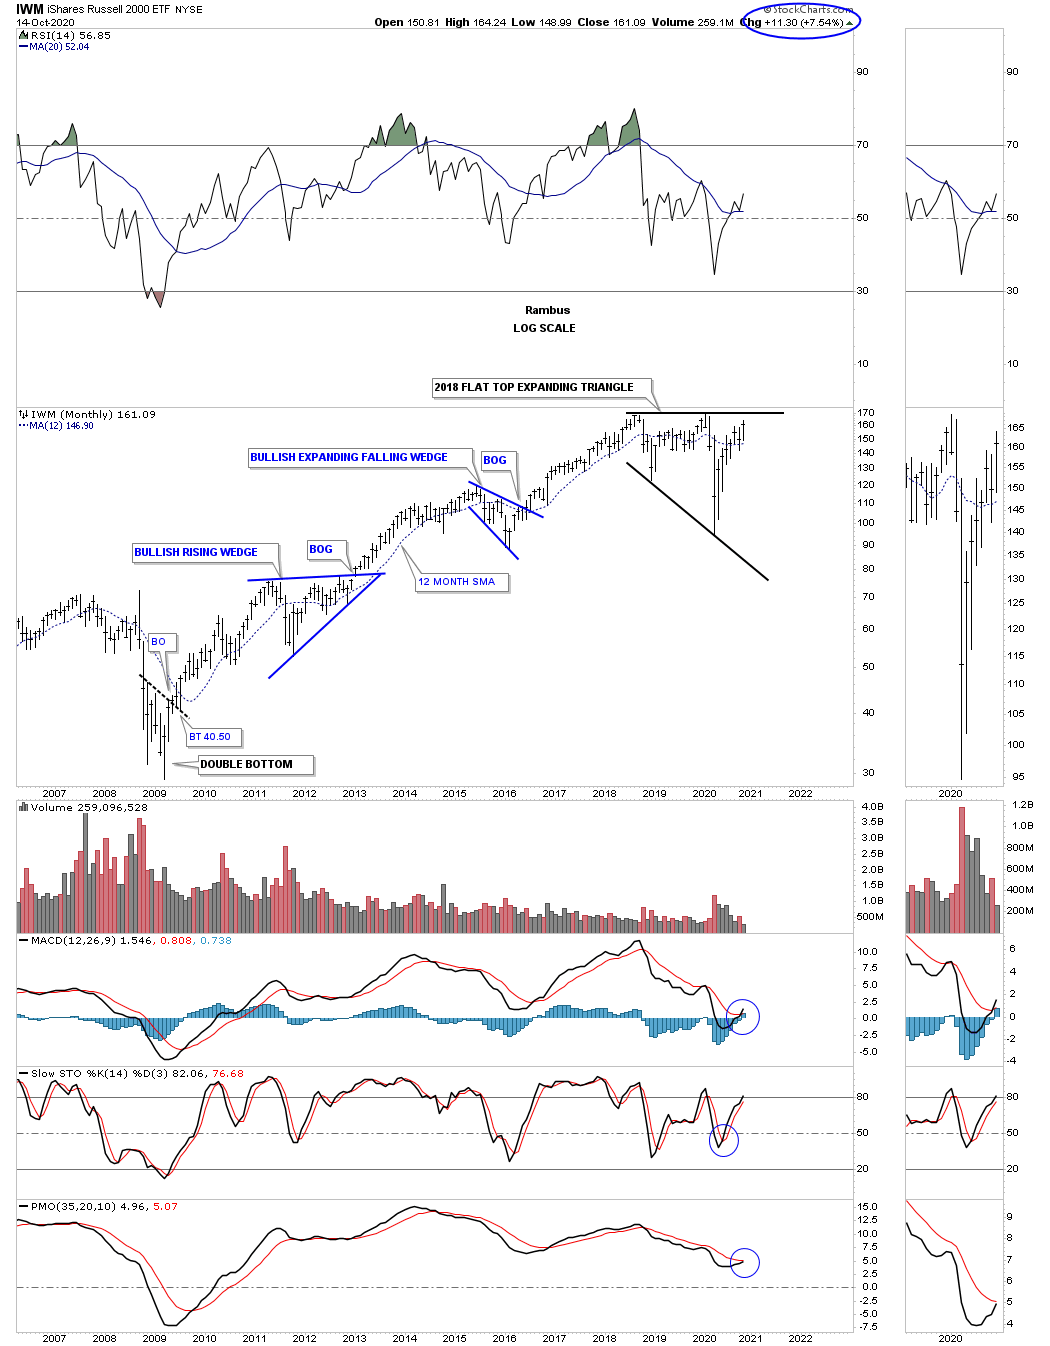
The IWM, small caps, has also enjoyed a strong secular bull market since its 2009 crash low. This index has been lagging a bit but it’s playing catch up and is approaching the top rail of its 2018 flat top expanding triangle. It’s important to look at the impulse moves between each consolation pattern to understand how markets work. You can’t have a strong impulse move if there is no consolation pattern to launch it, rinse and repeat.
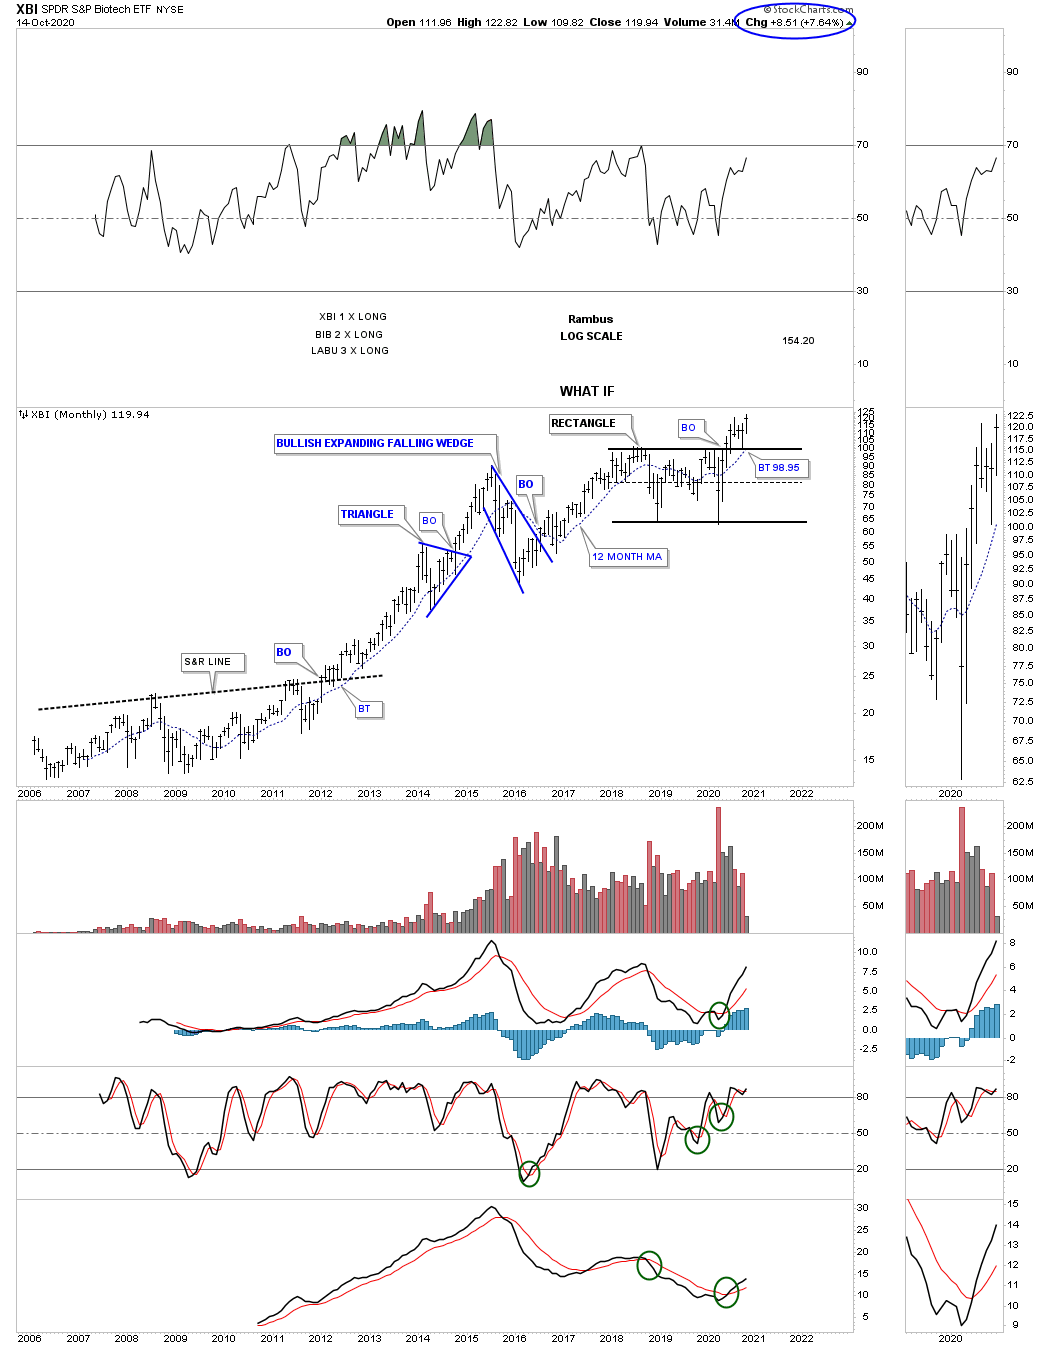
Lets look at a few sectors that make up the stock markets to see if they can help confirm the secular bull market is still alive and well. One of my favorite sectors has been the XBI, biotechs, which has broken out and backtested the top rail of its 2018 rectangle consolation pattern and is trading at a new all time high this month.
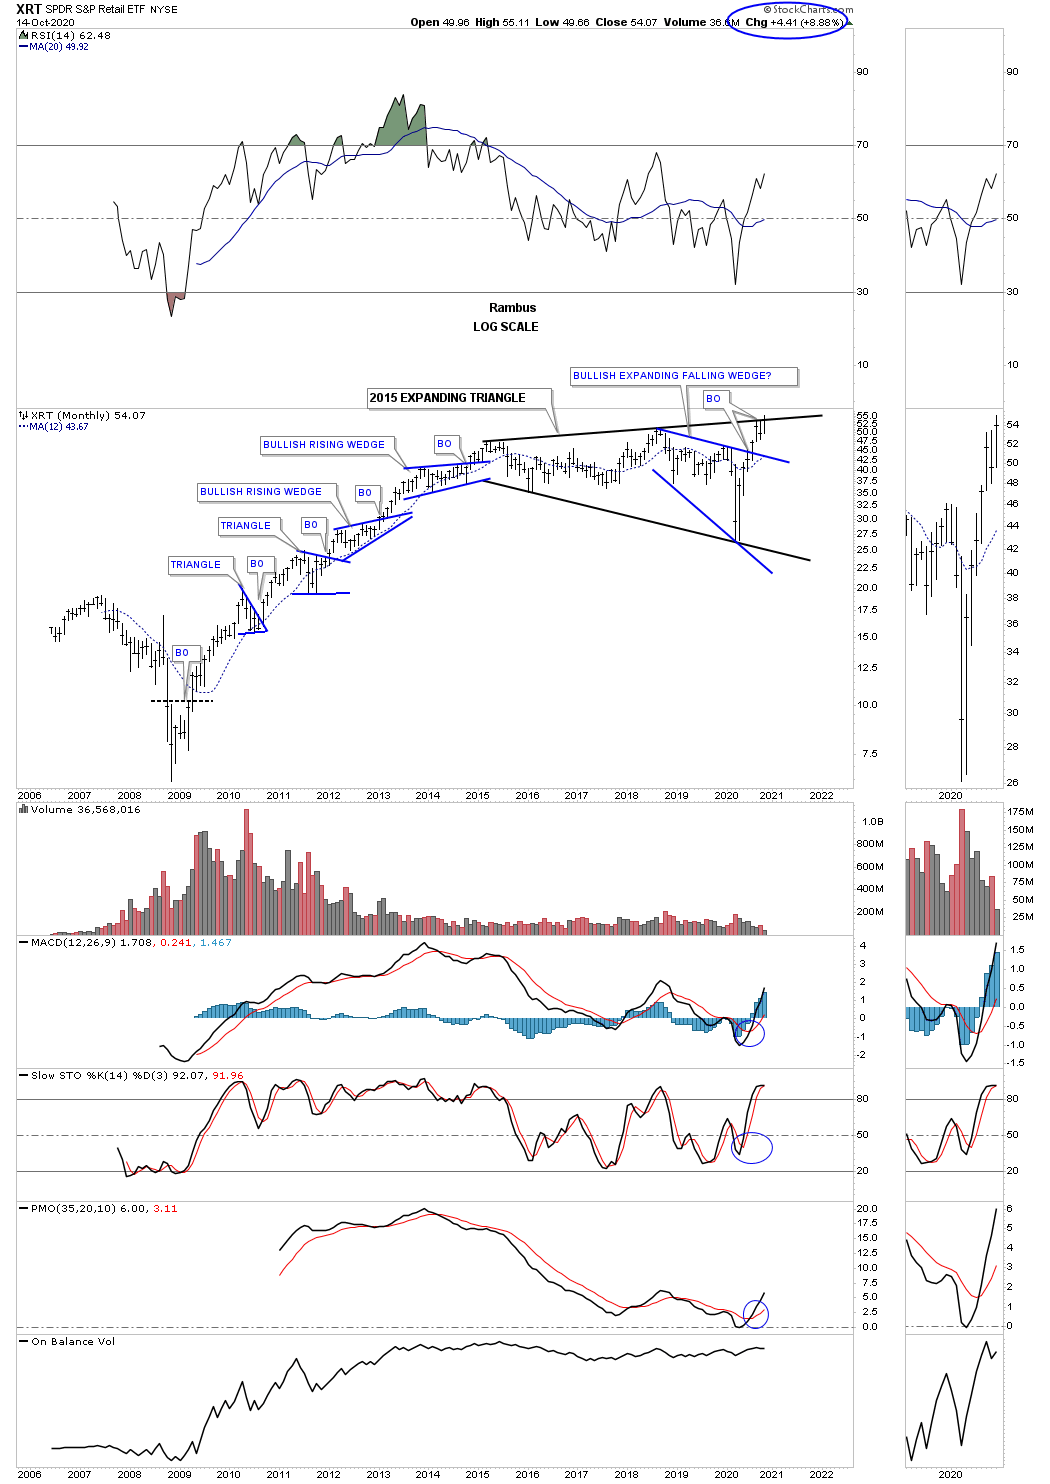
Another very strong sector is the XRT, retail etf, which is trading at new all time highs and is attempting to breakout from its 2015 black expanding triangle. Wha is so bullish about the Chartology is that the price action has already broken out from the smaller blue expanding falling wedge which is strongly suggesting the top rail of the 2015 expanding triangle is going to give way.
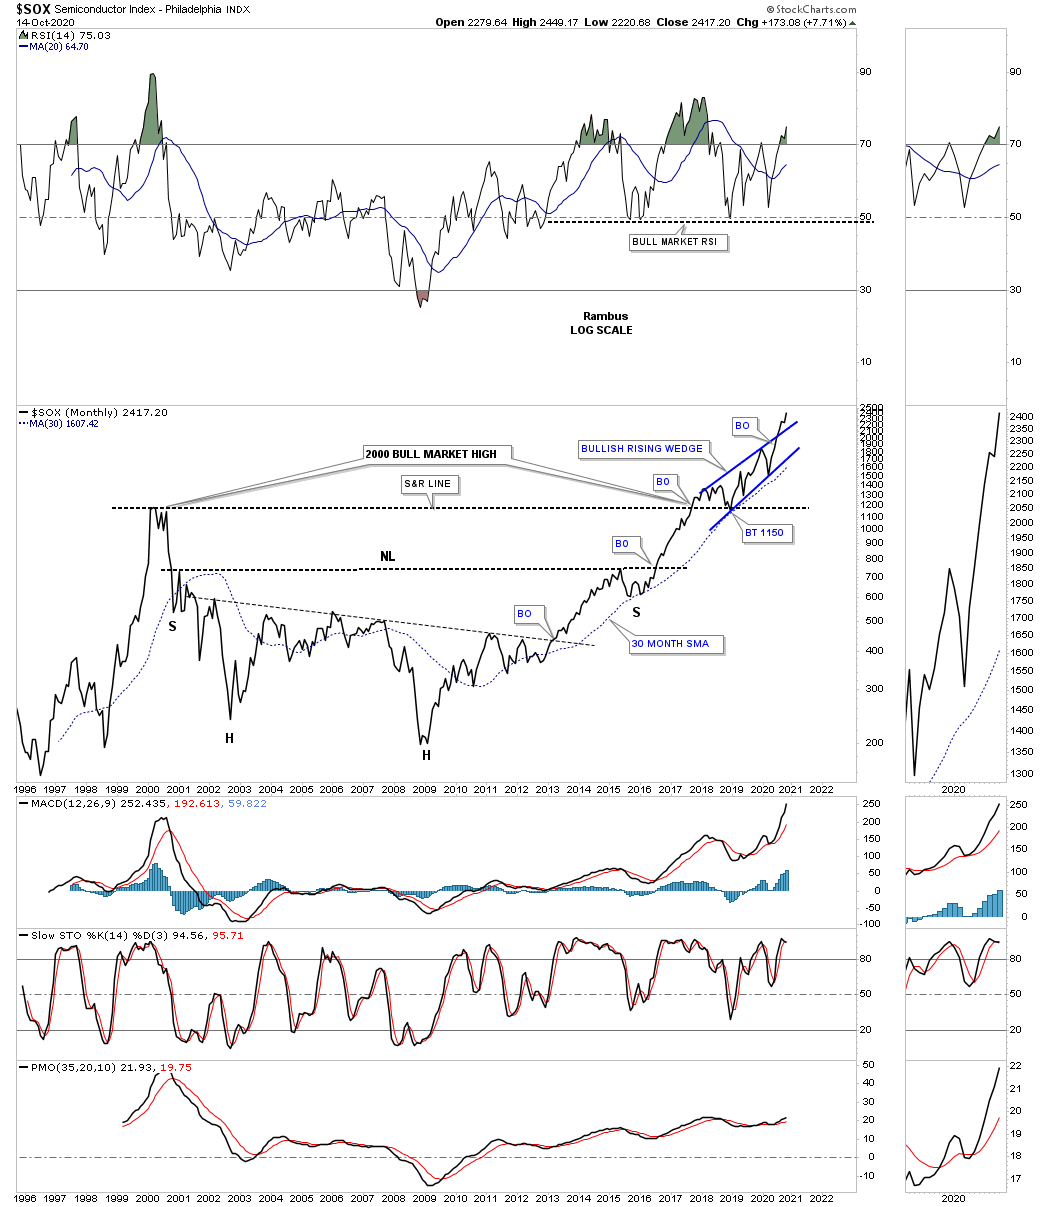
One of the strongest sectors in the markets right now is the SOX, semiconductor index. This 25 year monthly line chart shows a massive base with the blue bullish rising wedge forming on top of it. Note how the high made back at the 2000 bull market high reversed its role to support when the SOX broke out above that 17 year S&R line.
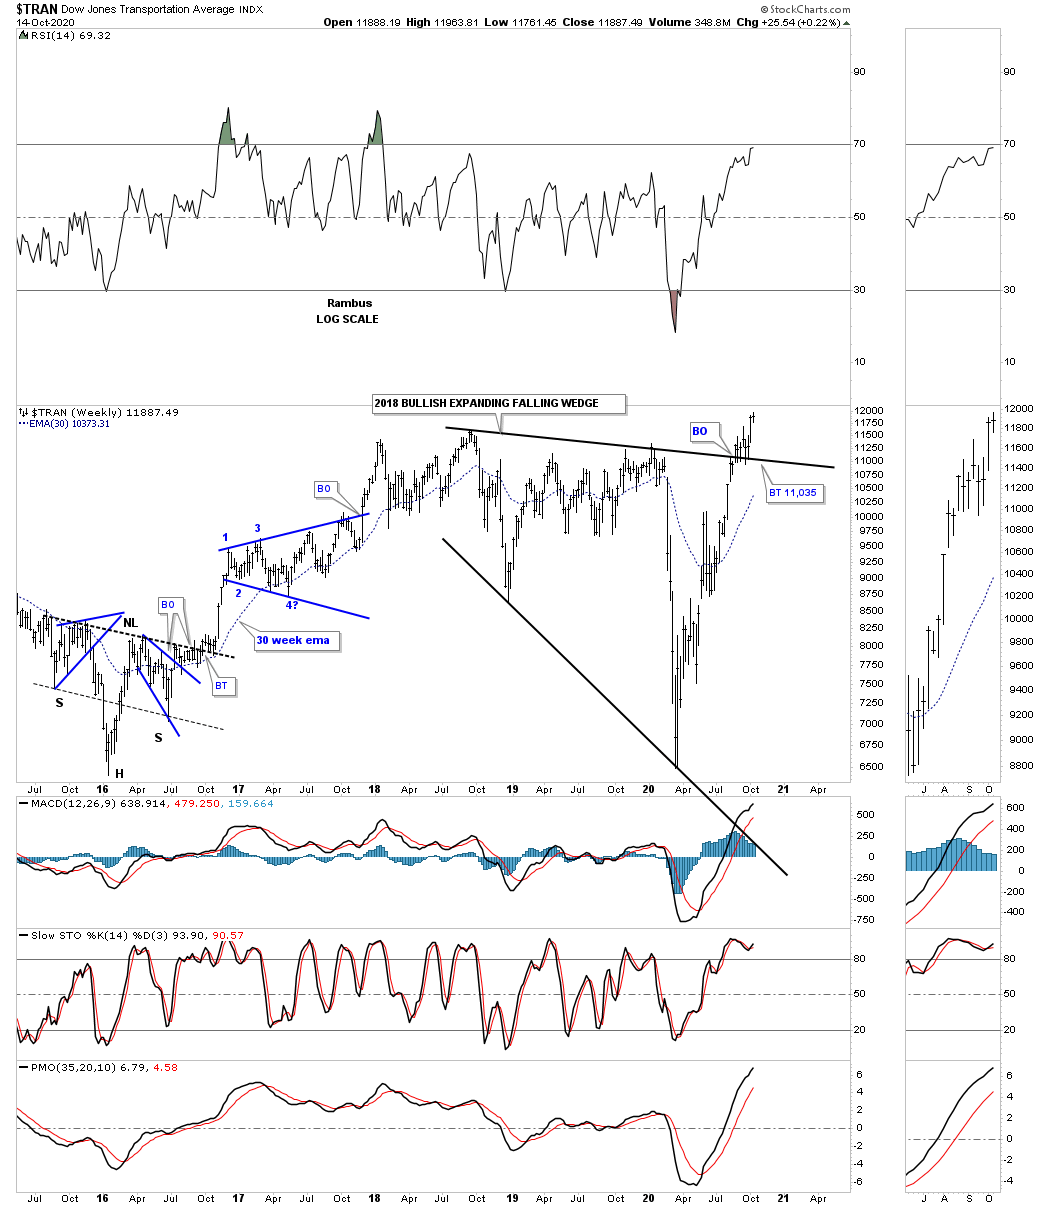
You can’t have a secular bull market without the Transportation Average participating. Below is a weekly chart which shows the price action breaking out from the 2018 bullish expanding falling wedge complete with a backtest to the top rail. You can also see the Transportation Average is trading at a new all time high.
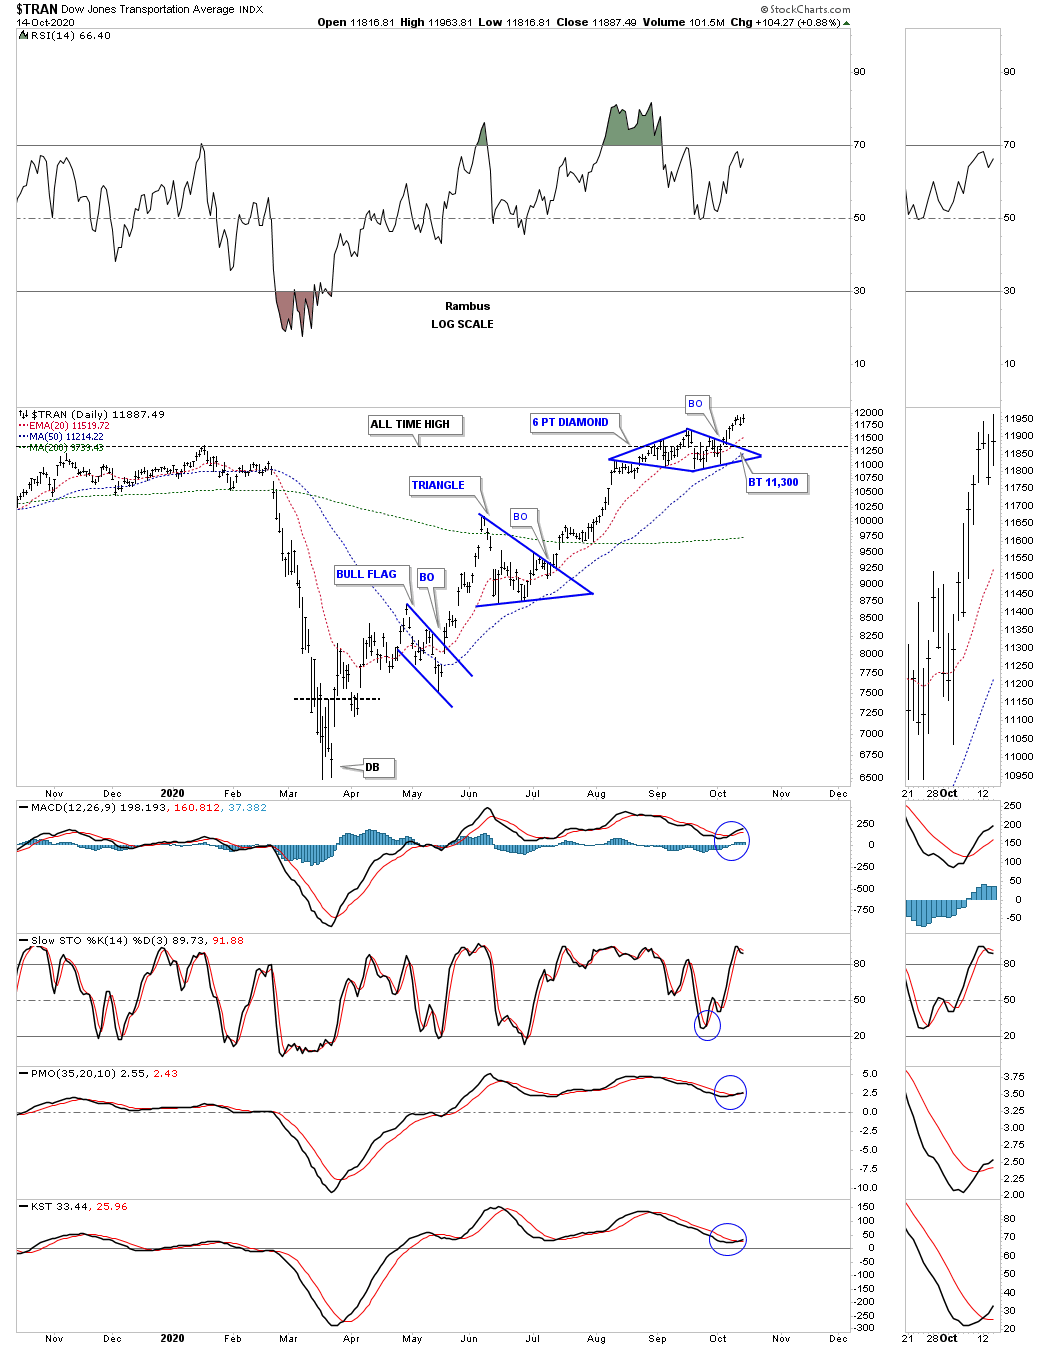
This daily chart for the Transportation Average shows the blue diamond that is sitting just above the top rail on the 2018 bullish expanding falling wedge on the chart above.
This last chart is the 100 year quarterly chart for the Transportation Average which shows all of its important consolation patterns through the years. If you look at the right sidebar you can see the price action is trading at a 100 year high.
If one can empty their head from all the fundamental reasons why the stock markets can’t go up you might surprise yourself by what you actually see with the price action alone. I’ve said this so many times in the past that I sound like a broken record, ” we are playing a game of psychological warfare more than anything else. If 2020 doesn’t make you question your beliefs in fundamentals then nothing will. The US stock markets have been in a secular bull market since the 2009 crash low and not even a worldwide pandemic can stop it. That should tell you all you need to know. All the best…Rambus
![]()
Related Reading:
- Rambus: Blockbuster Chartology – July, 2020
- Rambus: Blockbuster Chartology – May, 2020
- Rambus: Blockbuster Chartology – January, 2020
- Rambus: Blockbuster Chartology – October, 2019
- Rambus: Blockbuster Chartology – July, 2019
- Rambus: Blockbuster Chartology – April, 2019
- Rambus: Blockbuster Chartology – January, 2019
- Rambus: Blockbuster Chartology – October, 2018
- Rambus: Blockbuster Chartology – July, 2018
- Rambus: Blockbuster Chartology – April, 2018
- 2017 Annual Wrap Up – Does Your Pension Fund Have A Deep State Drain? – January, 2018
- 1st Quarter Wrap Up 2018 Web Presentation
- Blockbuster Chartology with Rambus – October, 2017
- Blockbuster Chartology with Rambus – July, 2017
- Blockbuster Chartology with Rambus – May, 2017
- Blockbuster Chartology with Rambus – January, 2017
- Blockbuster Chartology with Rambus – October 20, 2016
- Blockbuster Chartology with Rambus – July 21, 2016
- Blockbuster Chartology with Rambus – April 21, 2016
- Rambus: Are We in a Deflationary Spiral? – January 28, 2016
- The Dollar, Gold & the S&P 500 with Rambus – October 15, 2015